Making Better Decisions in Enhanced Geothermal Systems: A Probabilistic Modeling Approach
Enhanced Geothermal Systems (EGS) represent one of the most promising pathways to reliable, clean baseload power. Unlike traditional geothermal resources that depend on naturally occurring steam reservoirs, EGS creates artificial reservoirs in hot dry rock, dramatically expanding the geographic potential for geothermal energy. Yet despite this promise, EGS projects face a fundamental problem: how do you make confident investment decisions when drilling miles into the earth, where a single temperature variation of 20°C or a miscalculation in rock permeability can transform a profitable project into a financial loss?
Traditional techno-economic models struggle with this reality. Most rely on single-point estimates—assuming the reservoir will be exactly 200°C, that drilling will cost precisely $12M per well, that the power plant will achieve 95% availability. These deterministic approaches create an illusion of certainty in an inherently uncertain environment.
The consequences are real. Projects either appear artificially attractive (leading to poor capital allocation) or overly pessimistic (causing investors to walk away from viable opportunities). Neither outcome serves the industry’s need to scale rapidly and efficiently.
What if, instead of fighting uncertainty with simplified assumptions, we built it directly into our analytical framework? What if geological risk, engineering variables, economic factors, and fiscal policies were all represented as ranges of possibilities, with their interdependencies made explicit?
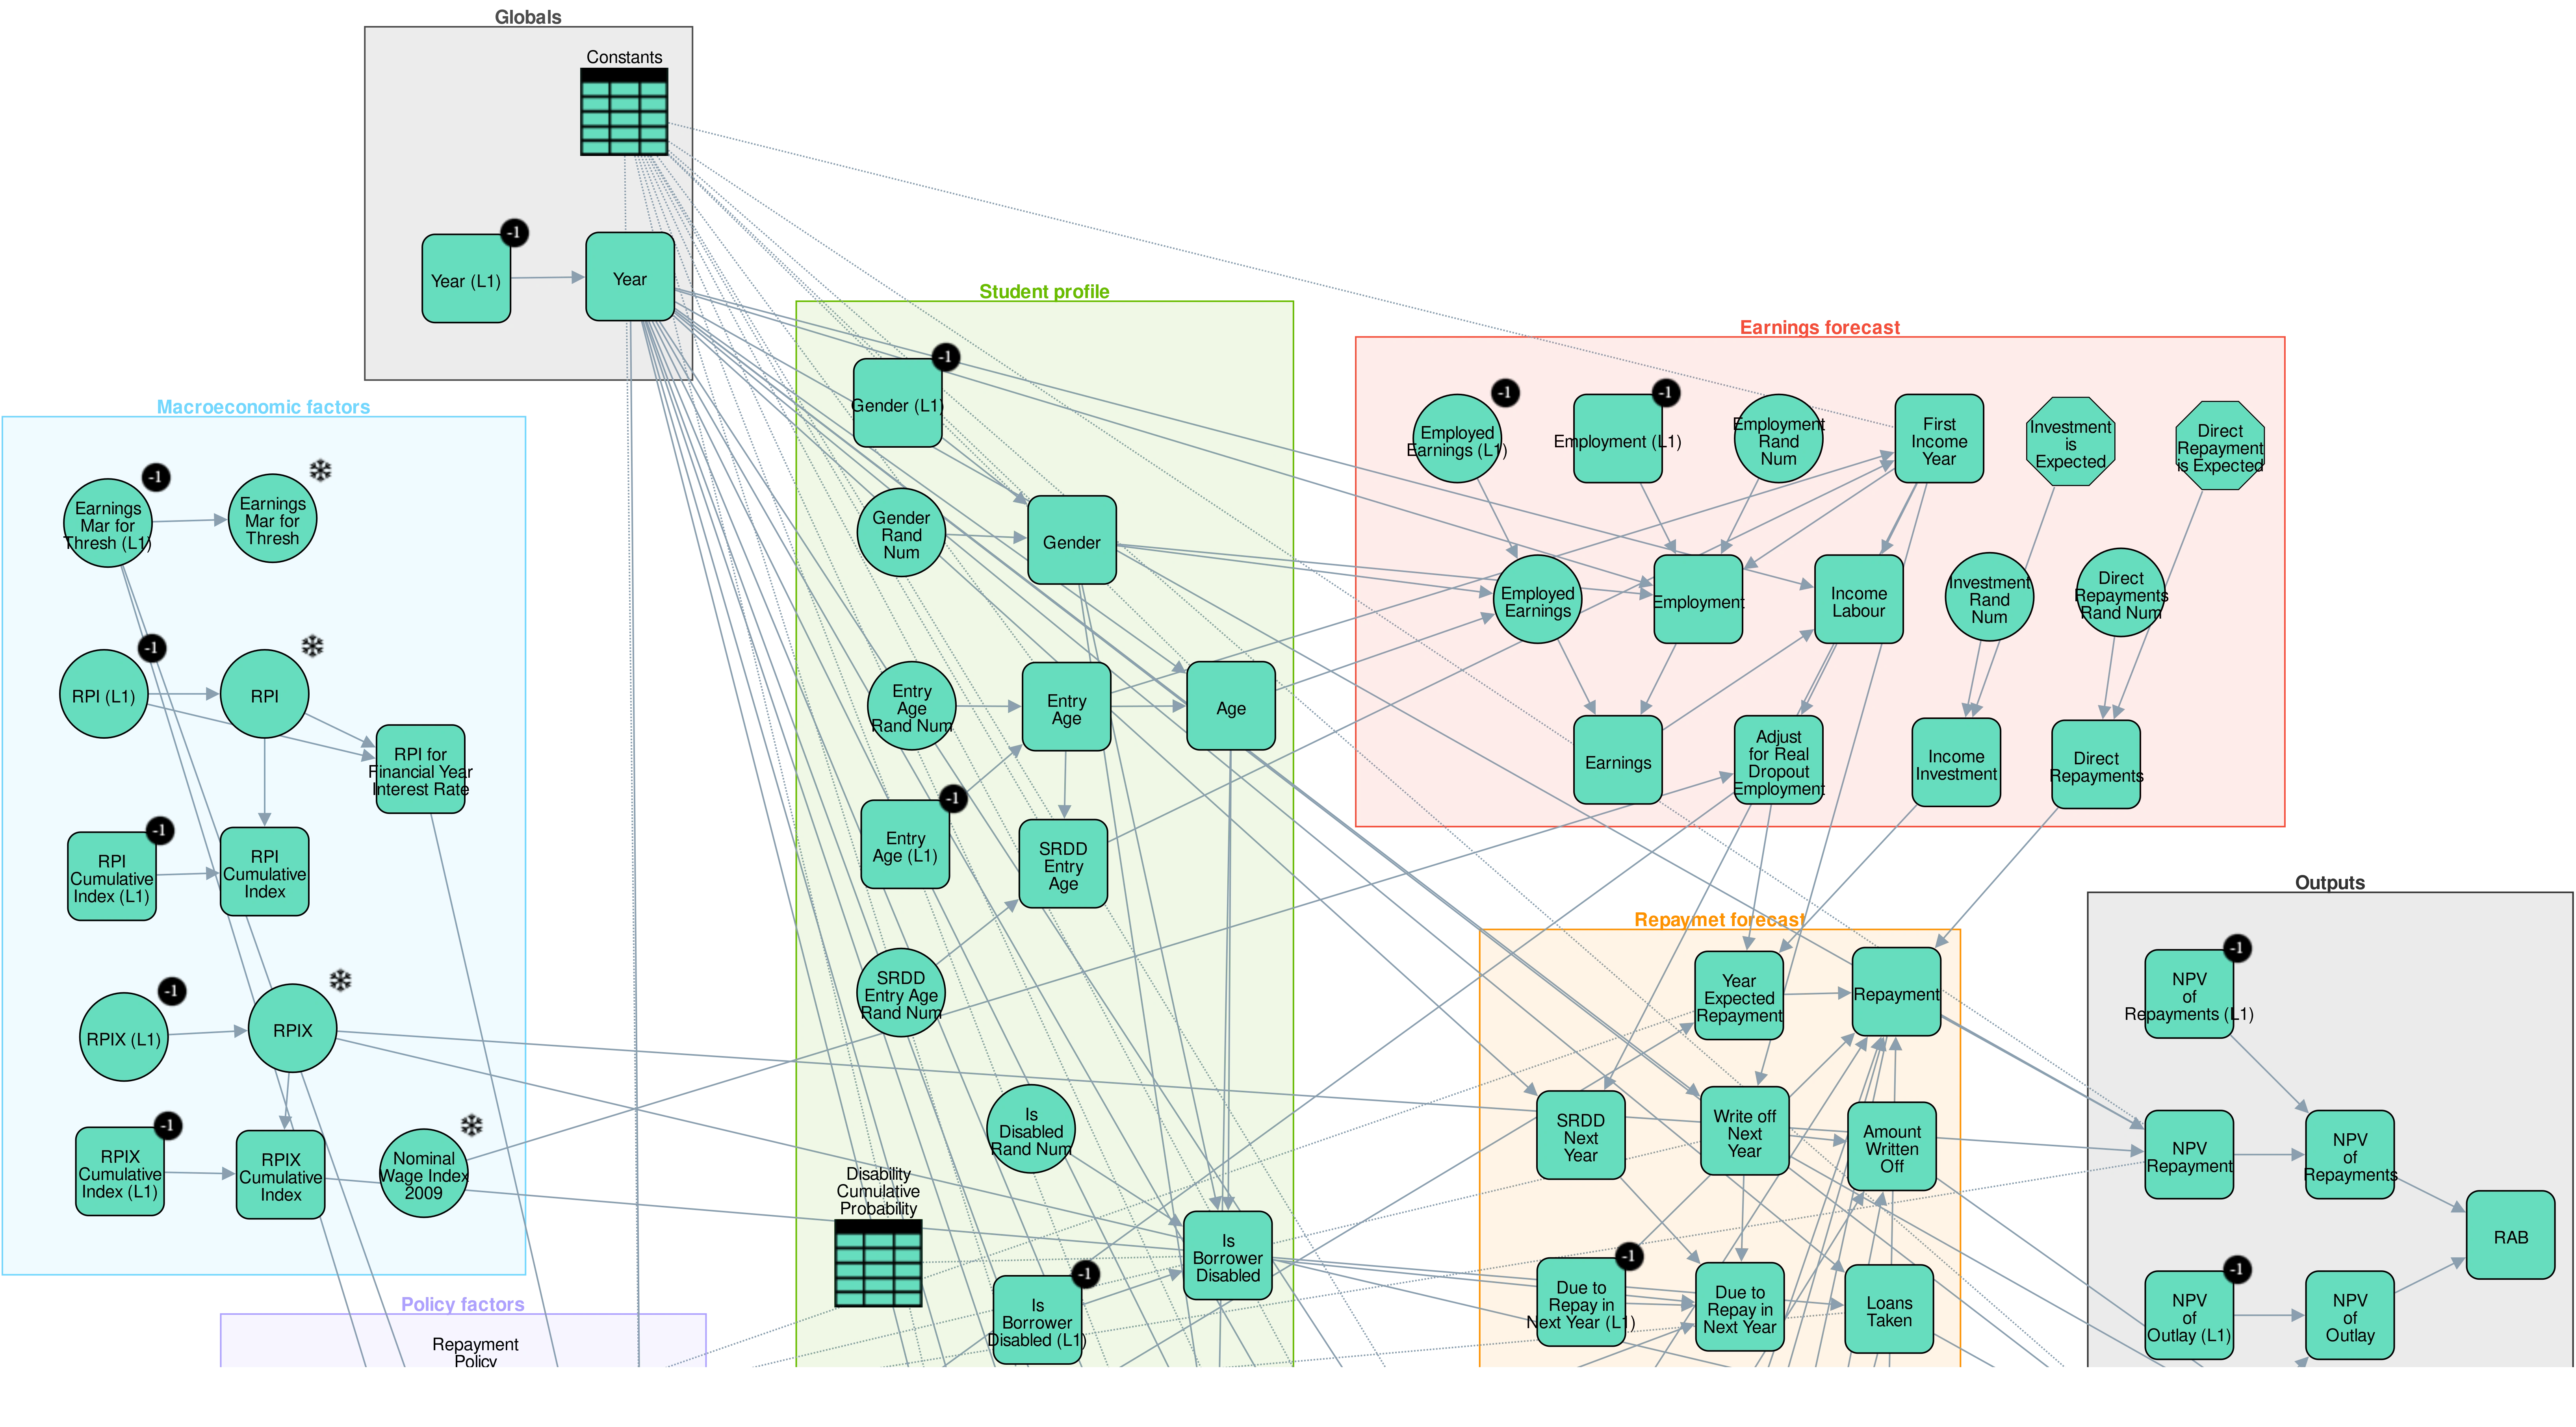
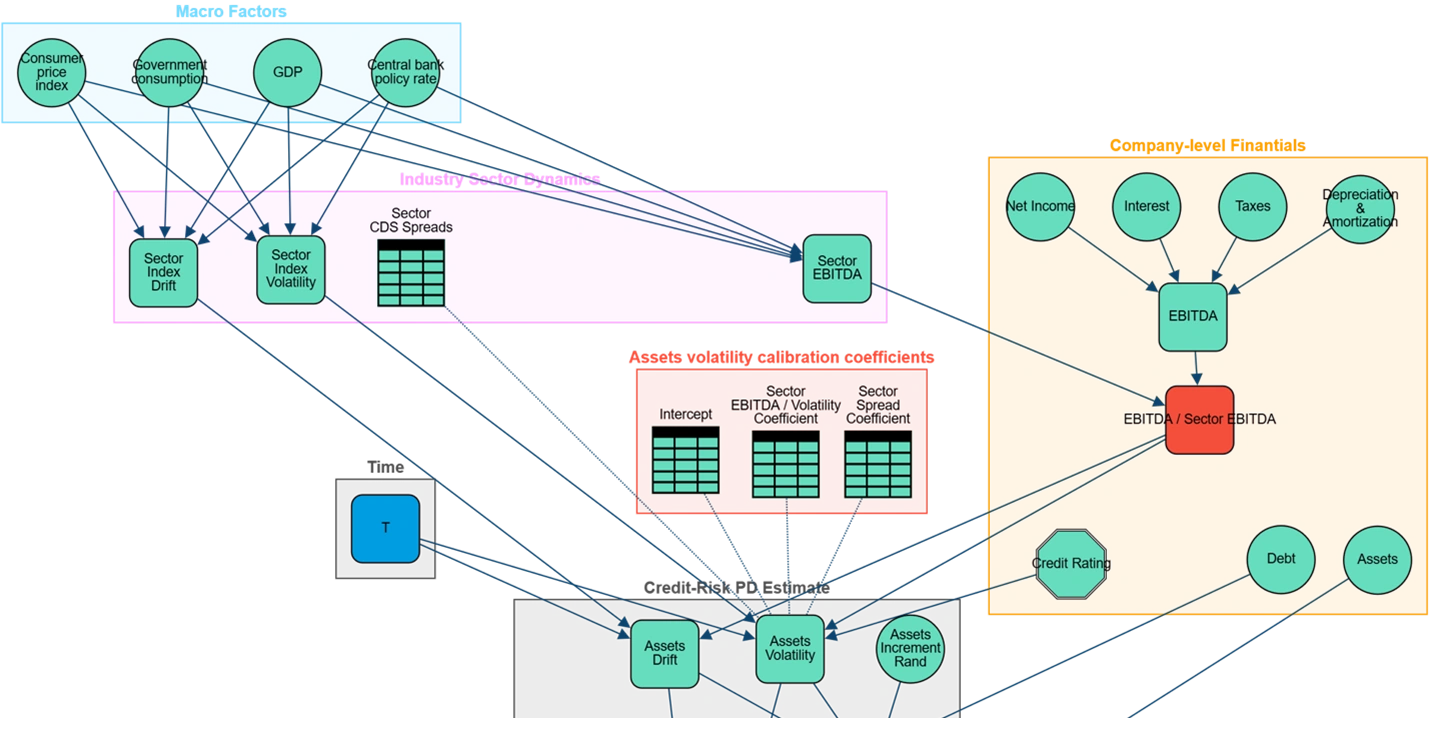
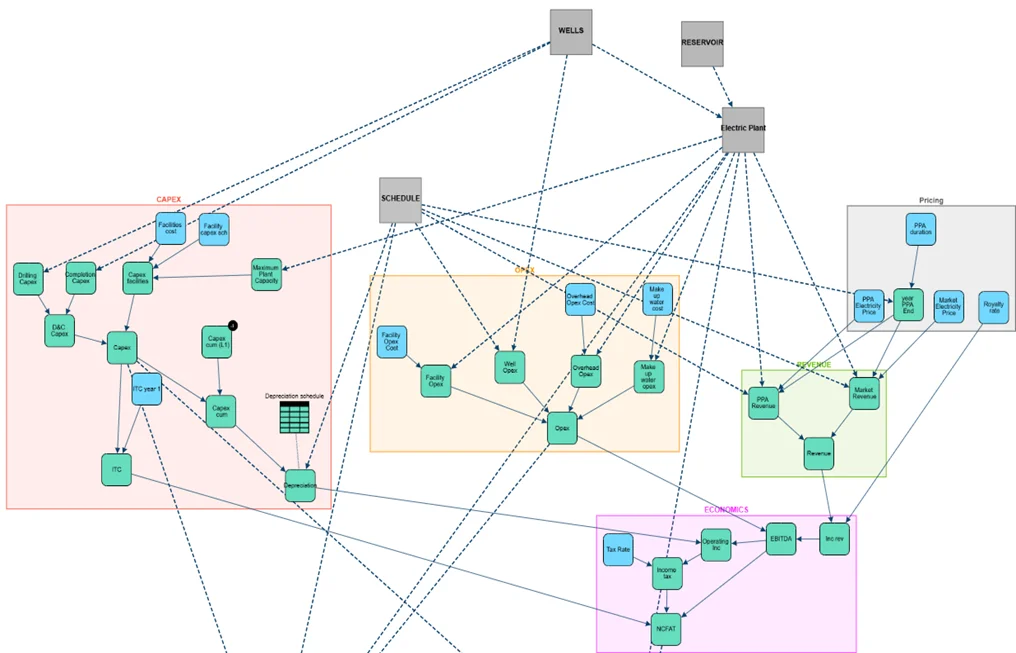
This is the foundation of probabilistic modeling using graphical frameworks. Rather than hiding complexity, this approach exposes it—making the connections between variables visible and quantifiable. The result is a model that doesn’t just calculate outcomes; it reveals how systems behave under uncertainty.
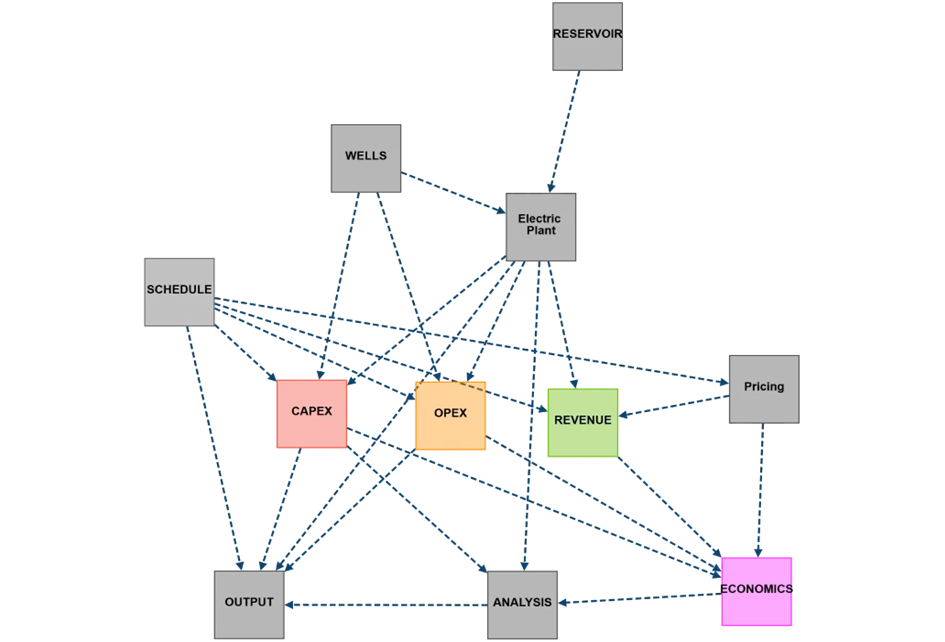
Any comprehensive EGS model must integrate four interconnected domains:
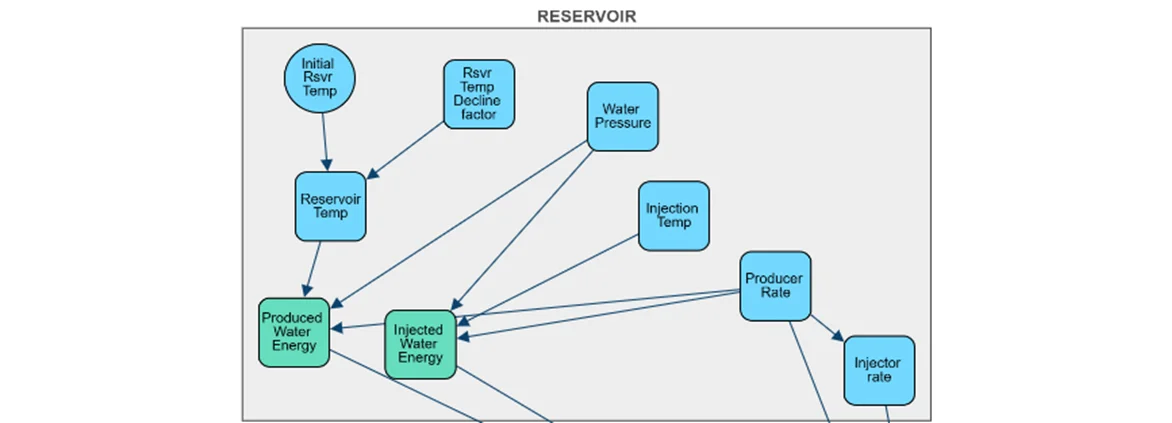
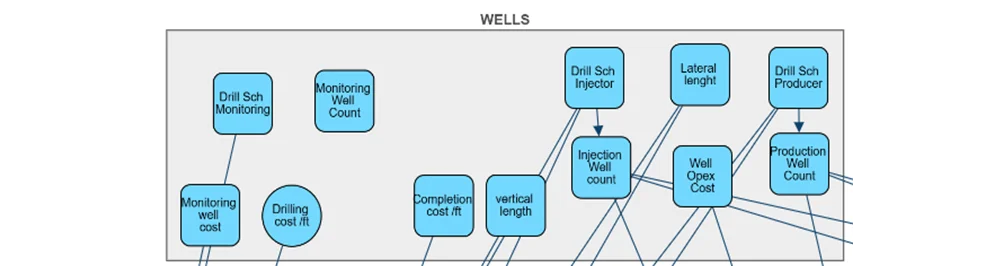
Geological Reality: The subsurface is never fully known. Reservoir temperature (Treservoir), permeability, rock mechanics, and seismic risk all carry inherent uncertainty. Rather than picking conservative or optimistic values, each parameter is represented as a probability distribution informed by well logs, seismic surveys, and analogous field data.
Engineering Design: Decisions cascade from subsurface to surface. Well depth (Dwell), the number of injection and production wells (Nwells), drilling completion strategies, and reservoir management plans all interact. On the surface, the choice between dry steam, flash steam, or Organic Rankine Cycle (ORC) technology depends on the temperature profile emerging from below. These aren’t independent choices—they’re a tightly coupled system.
Economic Forces: Capital expenditures vary with drilling depth and geological complexity. Operating costs depend on pumping requirements and maintenance schedules. Power prices fluctuate with market conditions and grid integration challenges. Each of these carries both uncertainty and correlation with other variables.
Fiscal Framework: Tax structures, royalty rates, investment tax credits, and production incentives vary by jurisdiction and change over time. These aren’t peripheral concerns—they directly impact project cash flows and, consequently, the risk-adjusted return profile.
The model begins not with single numbers, but with distributions representing our state of knowledge:
- Reservoir temperature might be normally distributed with µ = 210°C and s = 15°C based on offset well data
- Drilling costs could follow a lognormal distribution reflecting the long tail of complications
- Power prices might be modeled with mean reversion reflecting grid supply-demand dynamics
Each variable becomes a node in a graph. The edges connecting these nodes represent dependencies: reservoir temperature influences drilling depth, which influences cost, which influences NPV. By making these relationships explicit and visual, the model becomes immediately interpretable.
This layer transforms geological potential into electrical output. It asks: given a distribution of reservoir conditions and engineering choices, what is the distribution of power generation?
For the subsurface, the model simulates heat extraction rates (Qheat) based on the engineered fracture network’s behavior over time. It accounts for thermal drawdown, pressure maintenance requirements, and the risk of short-circuiting between injection and production wells.
For the surface facility, the model differentiates between conversion technologies:
- High-enthalpy resources (>180°C): Flash or dry steam systems with direct steam-to-electricity conversion
- Moderate-temperature resources (120-180°C): ORC systems using organic working fluids to extract work from lower-grade heat
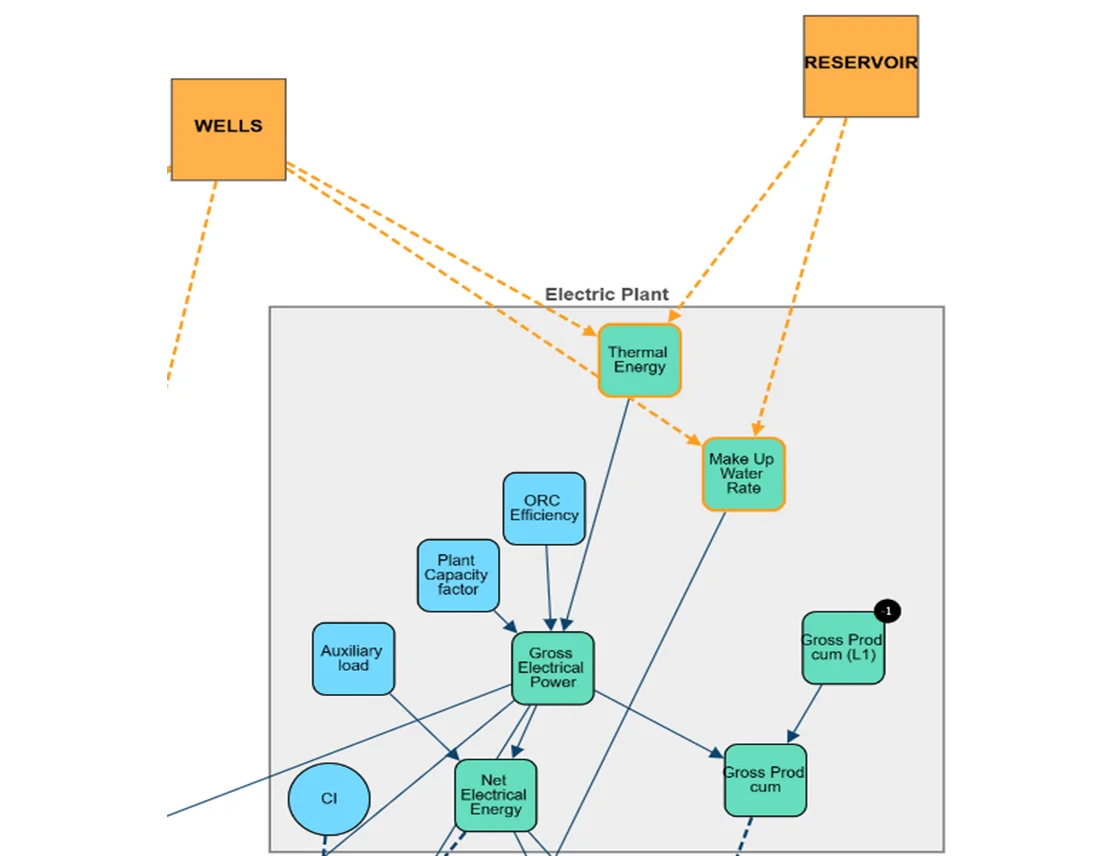
The gross power output (Pgross) emerges not as a single value, but as a time-dependent distribution reflecting all upstream uncertainties and their propagation through the system.
The final layer converts physical performance into financial outcomes. Revenue streams are the product of power output distributions and price distributions. Cost structures include:
- CAPEX: Drilling, completion, surface plant construction
- OPEX: Pumping energy, maintenance, administration
- Fiscal obligations: Production taxes, royalties, local fees
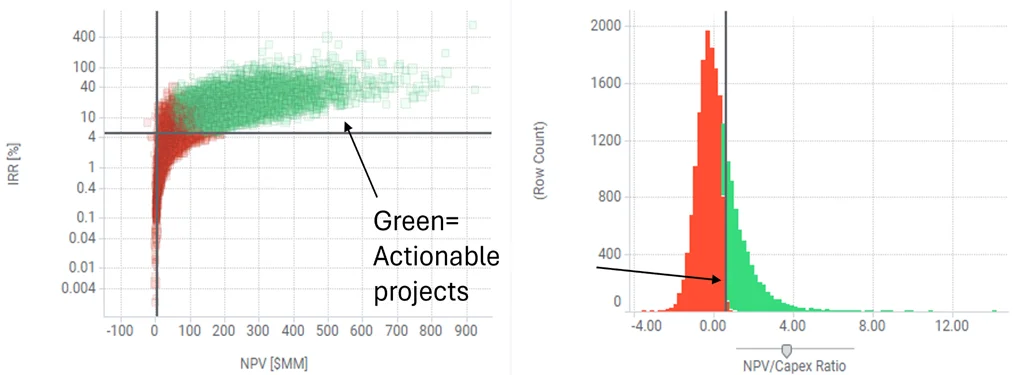
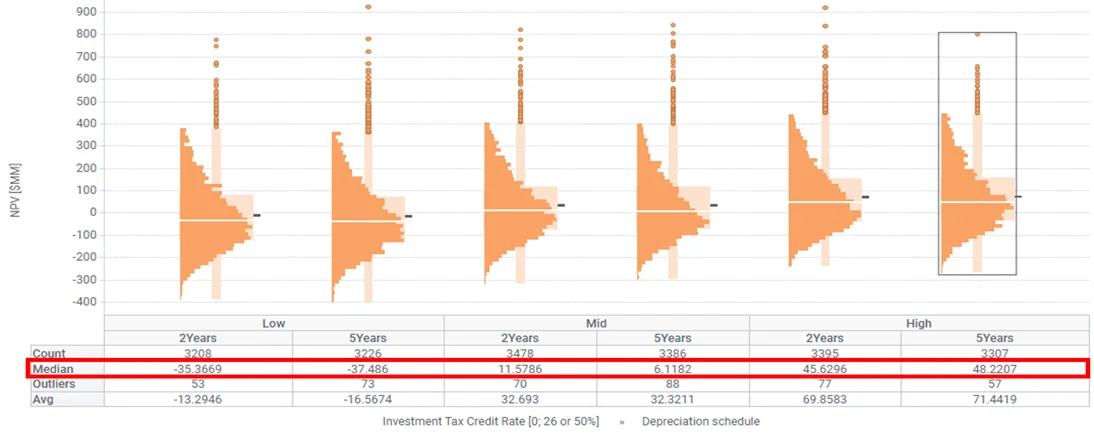
Because every input is probabilistic, the output is a full distribution of NPV, IRR, and cash flow profiles over the project life. This isn’t a single pro forma with sensitivity cases—it’s a comprehensive probability space of outcomes.
Once deployed, a graphical model becomes a living tool. As drilling reveals actual reservoir conditions, posterior distributions replace priors, and the model updates in real-time. Early wells that encounter lower-than-expected permeability immediately trigger revised completion strategies and surface plant sizing recommendations. The model doesn’t just analyze—it guides.
Consider a 50 MW EGS project in the Western U.S. Traditional analysis shows:
- Estimated reservoir temperature: 200°C
- Drilling cost: $10M per well
- Expected IRR: 12%
- Recommendation: Marginal project, requires additional data
A probabilistic graphical analysis reveals:
- Temperature distribution: Mean 205°C, but 25% probability of exceeding 220°C
- Drilling cost distribution: Strong negative correlation with depth, which correlates with temperature
- Fiscal incentives: Production tax credit has 70% probability of being renewed based on policy momentum
- Net result: 68% probability of IRR > 12%, 25% probability of IRR > 18%
The recommendation shifts: This is an attractive risk-adjusted opportunity, particularly if early wells can confirm the higher-temperature scenario. Risk mitigation should focus on drilling optimization (the main cost driver) and securing offtake agreements to reduce price exposure.
The same data, viewed through probabilistic lens, yields fundamentally different decisions.
Start with the Graph, Not the Math
Before writing equations, draw the dependencies. Make the logical structure visual and explicit. This forces clarity about what drives what—and reveals gaps in understanding before they become numerical errors.
Distributions Reflect Knowledge, Not Opinions
Every distribution should be defensible. Use historical data where available, physics-based constraints where applicable, and expert elicitation with proper calibration protocols. Document assumptions aggressively.
Validate Against Reality
Probabilistic models can be backtested. As projects complete, compare actual outcomes to predicted distributions. A well-calibrated model should see roughly 20% of outcomes in the P10-P30 range, not clustered at P50.
Iterate and Refine
Models are never finished. As new data arrives—from drilling, from reservoir testing, from adjacent projects—update priors and refine correlations. The model’s value increases with use.
Make It Accessible
A model that only specialists can interpret has limited value. Build interfaces that let geologists ask 'what if we see this rock type?' and CFOs ask 'how does this change our capital efficiency?' Democratize the insights.
While developed for geothermal systems, this modeling philosophy extends naturally to any capital-intensive project under uncertainty:
- Offshore wind: Wind resource, foundation costs, and grid connection
- Carbon capture: Capture rates, transport logistics, and storage integrity
- Mining: Grade distribution, extraction costs, and commodity prices
- Infrastructure: Demand forecasts, construction timelines, and regulatory evolution
The common thread is complexity that can’t be resolved by better data alone—it requires better models that honestly represent what we know, what we don’t, and how it all connects.
Enhanced Geothermal Systems investment decisions occur under substantial uncertainty across geological, engineering, economic, and regulatory domains. Traditional deterministic analysis inadequately represents this uncertainty structure, leading to systematic misallocation of capital and missed opportunities.
The probabilistic graphical framework presented here enables explicit quantification of project risks across multiple dimensions:
- Intrinsic geological risks from reservoir temperature, permeability, and rock mechanics uncertainty
- Engineering risks in drilling outcomes, well productivity, and surface plant performance
- Economic risks from cost overruns, construction delays, and operational variability
- Macro risks from power price volatility, policy changes, and incentive structure evolution
Decision-makers can evaluate alternative development strategies by measuring their complete risk-return distributions. A conservative drilling program may reduce capital exposure but limit upside capture if reservoir quality exceeds expectations. An aggressive program may offer higher expected returns but increased downside if geological conditions prove unfavorable. The framework quantifies these trade-offs explicitly.
The graphical structure reveals how risks propagate through project economics. Reservoir temperature uncertainty affects drilling depth requirements, which influences capital costs, which determines revenue thresholds for profitability. Surface plant technology selection depends on temperature distributions. Financing structures respond to overall risk profiles. These dependencies create correlation structures that conventional analysis overlooks.
This approach transforms EGS project evaluation from static feasibility assessment to dynamic risk management. Organizations can measure the value of information—quantifying how much uncertainty reduction from additional exploration justifies its cost. They can optimize decision sequencing—determining when to commit to surface plant construction versus awaiting confirmation well results. They can stress-test financial structures against downside scenarios.
For geothermal development organizations and their financial partners, this methodology provides systematic advantage. Rather than debating point estimates of project economics, stakeholders can align on acceptable risk profiles and evaluate alternative strategies against quantified uncertainty. Investment decisions shift from subjective judgment to measured risk-return assessment.
The analytical infrastructure exists for rigorous EGS project evaluation under uncertainty. Implementation separates organizations that systematically outperform capital allocation benchmarks from those relying on simplified deterministic analysis. In geothermal development where drilling programs commit tens of millions before reservoir confirmation, analytical rigor directly translates to capital efficiency.