Unlocking the Hidden Graph: How PGMs Transform Excel Model Silos into Actionable Enterprise Knowledge
For years, senior leaders have wrestled with the same paradox: the most crucial financial models, project schedules, and risk assessments, the very bedrock of strategic decision-making, are often trapped within countless Microsoft Excel files. These spreadsheets are powerful, flexible, and universally understood, making them indispensable. Yet, they are also the primary architects of organizational silos, hindering collaboration, obscuring risks, and breeding redundancy.
This challenge is reaching an inflection point. As organizations navigate the complexities of digital transformation, capital allocation, and climate risk, the lack of an integrated approach for strategic data is no longer sustainable.
The solution is not to replace Excel, but to radically amplify it.
This article explores a novel approach using Probabilistic Graphical Models (PGMs) to recognize the inherent structure within Excel, integrate siloed models into a unified, enterprise-scale decision network, and unlock new capabilities for risk management and synergy detection. We are moving beyond data warehousing and towards integrated knowledge management, where expert judgment and modeled relationships become the most valuable enterprise asset.
Why, in an era of sophisticated cloud platforms and powerful scripting languages, does the humble spreadsheet remain the single most pervasive decision-making tool for executives and analysts?
- Accessibility and Low Barrier to Entry: Virtually every business professional can use Excel. It is the lingua franca of finance, planning, and operations.
- Flexibility and Speed: Analysts can prototype complex models, perform quick calculations, and visualize data instantly, offering unparalleled speed for ad-hoc analysis.
- Visibility of Inputs: Unlike code-based models, inputs, calculations, and outputs are immediately visible on the screen, fostering a sense of control and transparency-even if that transparency is localized to the single file.
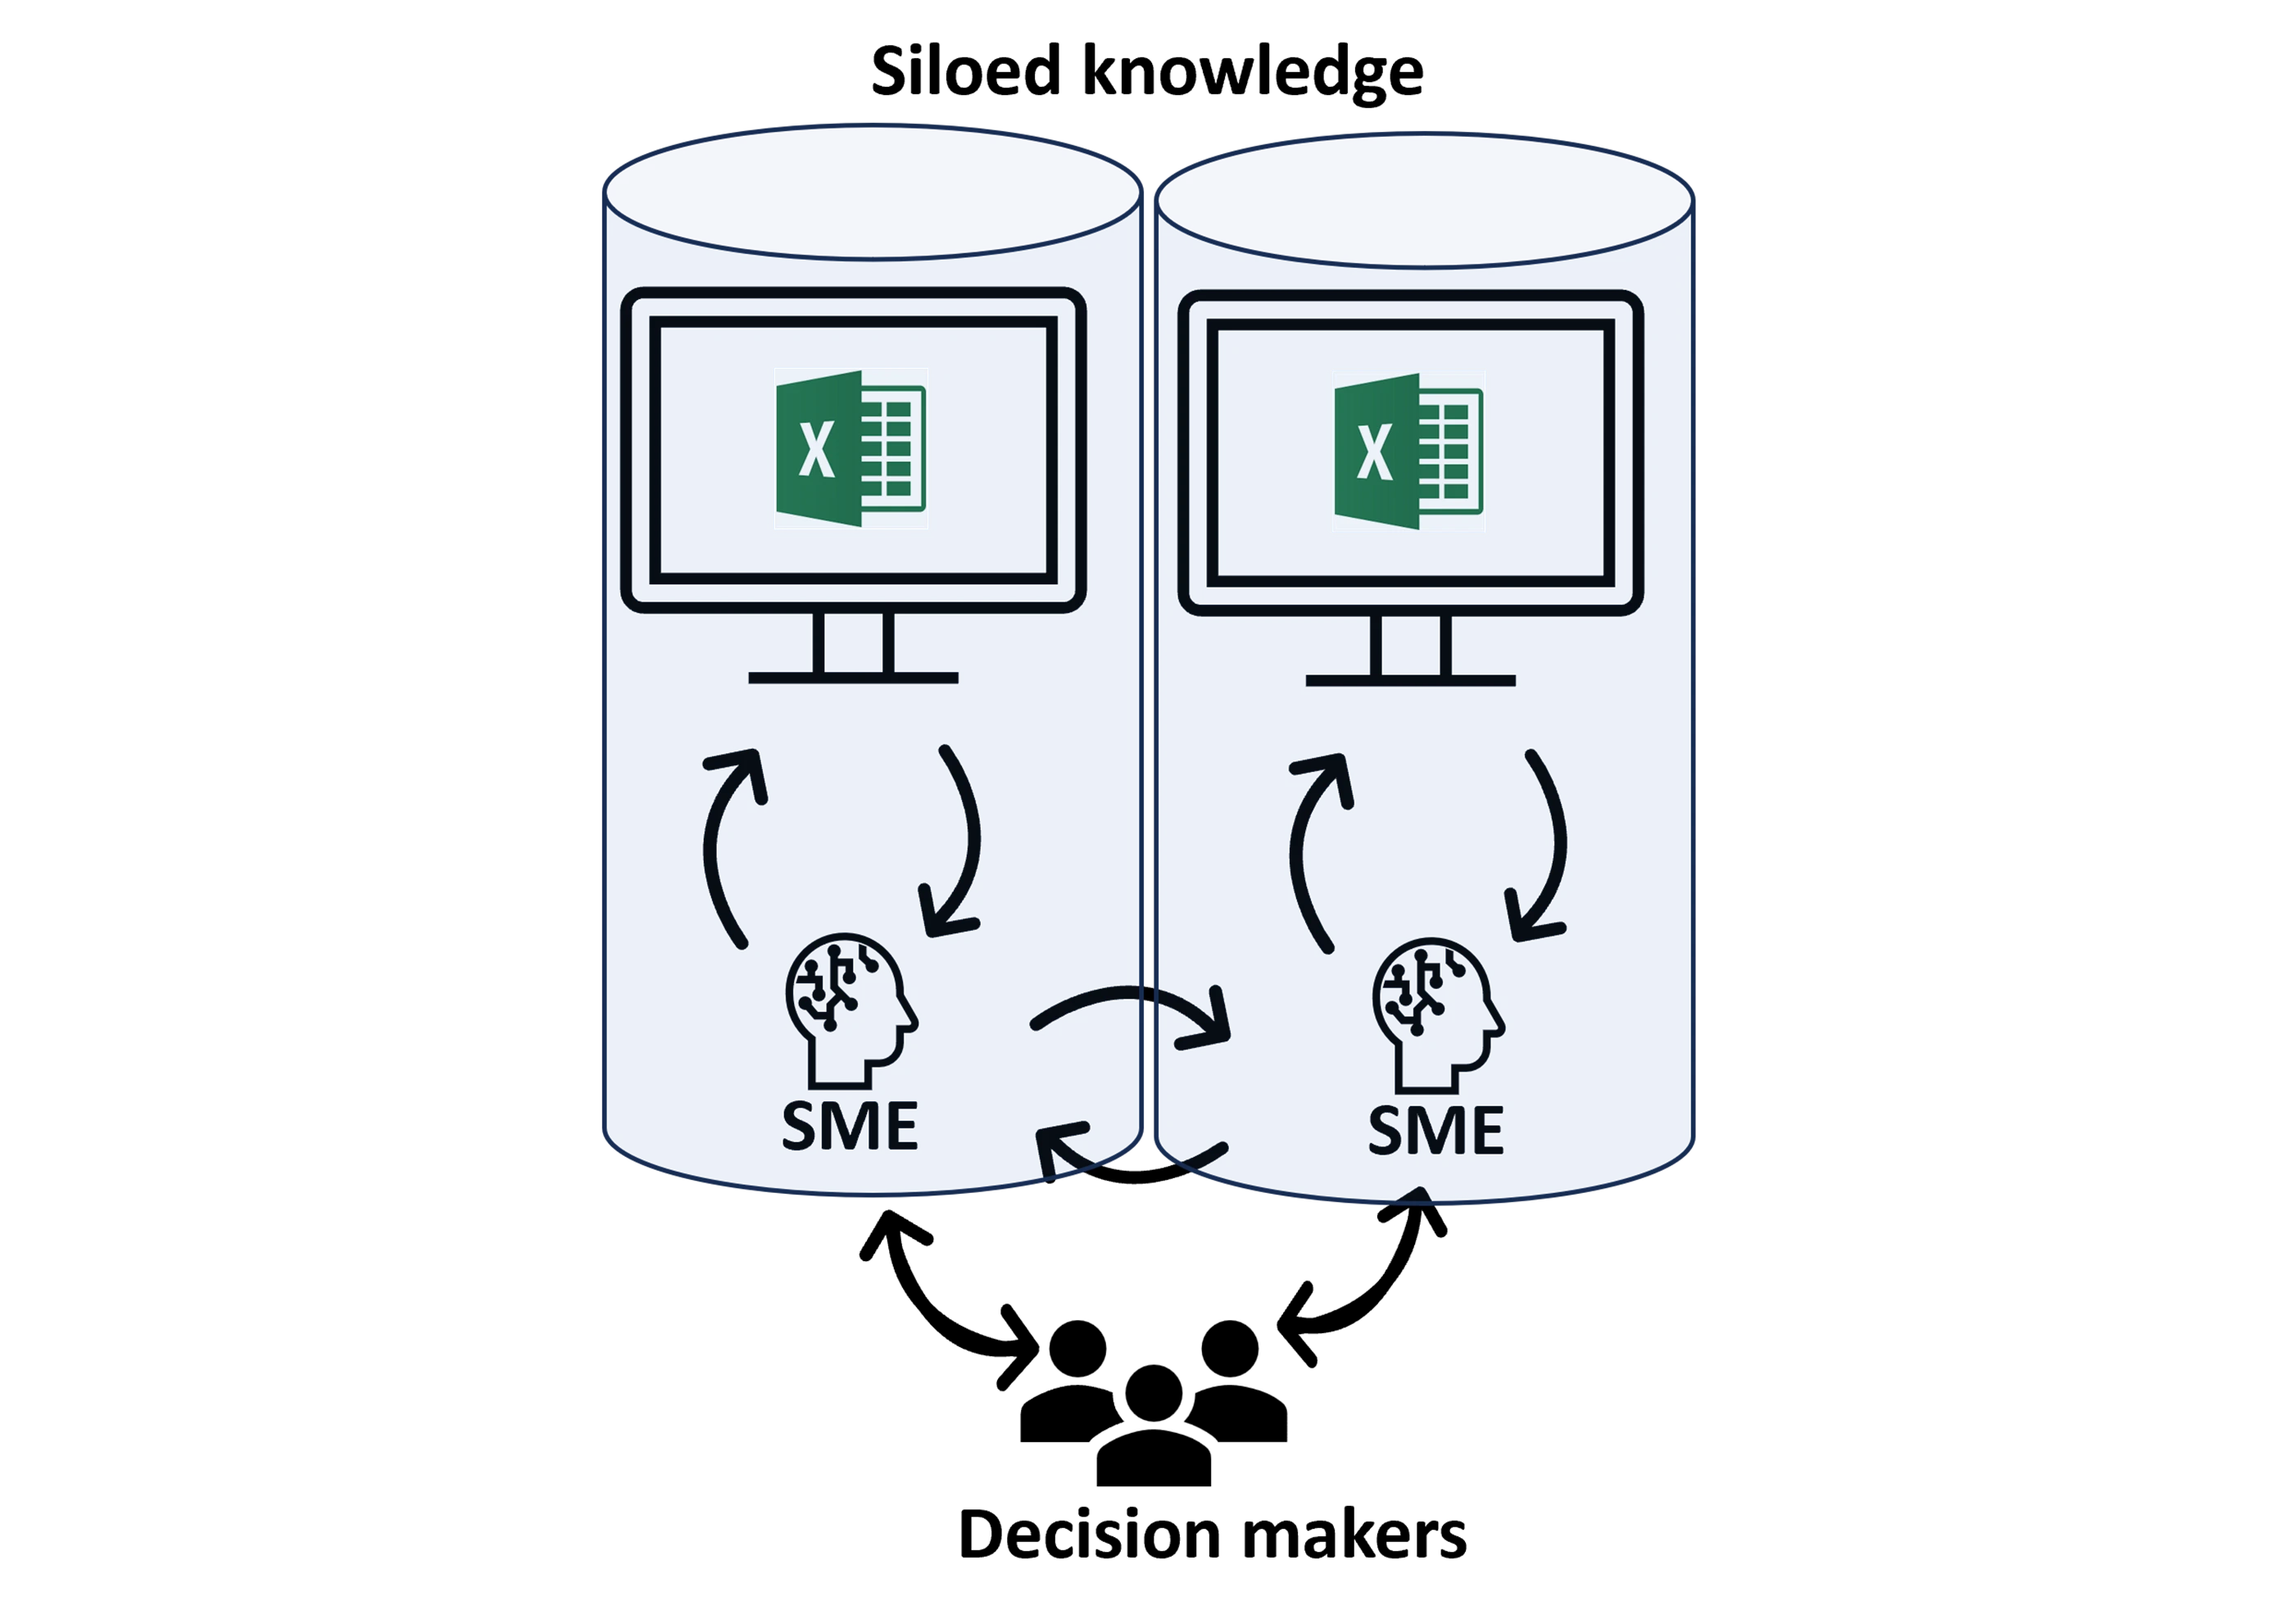
However, this flexibility comes at a severe cost. When Excel models are shared, copied, and customized across different business units-from Project A’s engineering team to Project B’s finance department, they become isolated knowledge silos.
The Hidden Costs of the Spreadsheet Silo:
- Reusability without traceability: Different teams build the same foundational models (e.g., corporate tax rate calculation, interest expense projections) independently, leading to wasted effort and inconsistent results; or teams copy/paste models and make changes. Without traceability, changes made are unclear and difficult to find.
- Operational risk due to a lack of a formal quality assurance process from the absence of traceability.
- Limited templatization due to the inability to extra sub-blocks of an Excel model to integrate into a different model.
- Computational limits: Excel is limited in terms of scalability for complex computations (like high-fidelity Monte Carlo simulations to represent accurately highly uncertain environments).
- Limited Interdependencies: The greatest risks often lie in the connections between projects-shared suppliers, common regulatory hurdles, or reliance on the same limited corporate resource. Isolated spreadsheets are blind to these critical synergies and shared risks.
- Not Scalable: Independent spreadsheets aren’t easily arranged into portfolios making efficient portfolio optimization very challenging.
The underlying intelligence, the network of calculations and expert assumptions, is present, but it is fragmented and untraceable. To solve this, we must first recognize Excel for what it truly is: a hidden graph.
The pursuit of pure code-based modeling sacrifices the very elements that make Excel and the PGM framework pragmatic for business:
- Sacrifice of Business Pragmatism and Communication: Business decisions are fundamentally made through communication, negotiation, and consensus. Excel is a universally understood visual language that facilitates this. Pure Python code is a communication barrier that executives, non-technical analysts, and auditors are unwilling or unable to cross, sacrificing the trust and shared understanding that are at the core of every strategic decision.
- Unnecessary Barrier to Entry: Python creates an unnecessary hurdle for the majority of the organization’s modeling talent. Requiring analysts to master coding, manage virtual environments, install complex packages, and debug scripts creates an artificially high barrier to entry, transforming highly valuable domain experts into generic programming novices.
- Impractical Agility for High-Stakes Scenarios: While code (especially Python) emphasizes abstraction and efficiency by removing redundancy, this layered complexity makes it impractical to take, modify, and adapt in a timely manner. In a 23rd-hour crunch, an analyst can quickly inspect and modify an Excel formula; they cannot reliably trace a multi-file Python class structure without deep programming knowledge. The requirement for rapid, auditable adaptation often favors the explicit, simple structure of a spreadsheet over the clean abstractions of code
- Commoditization of the Modeler: A focus on mastering the form (the language, the architecture) over the content (the financial, technical, or economic insight) risks commoditizing the modeler. Recent progress in Large Language Models (LLMs) demonstrates that syntax and boilerplate code can be generated automatically. If the modeler’s primary value rests in mastering a language rather than providing innovative technical or financial insight, their role is easily marginalized. The PGM approach, by contrast, elevates the modeler to the role of knowledge architect, focusing their expertise on the structure of the relationships and the capture of expert judgment.
The Python paradigm is excellent for development and massive data processing, but it is not inherently fit for the communication-driven, audit-reliant, and highly pragmatic environment of corporate decision-making. The PGM solution offers the necessary middle ground: Python’s scalability for computation, but Excel’s transparency for human intelligence.
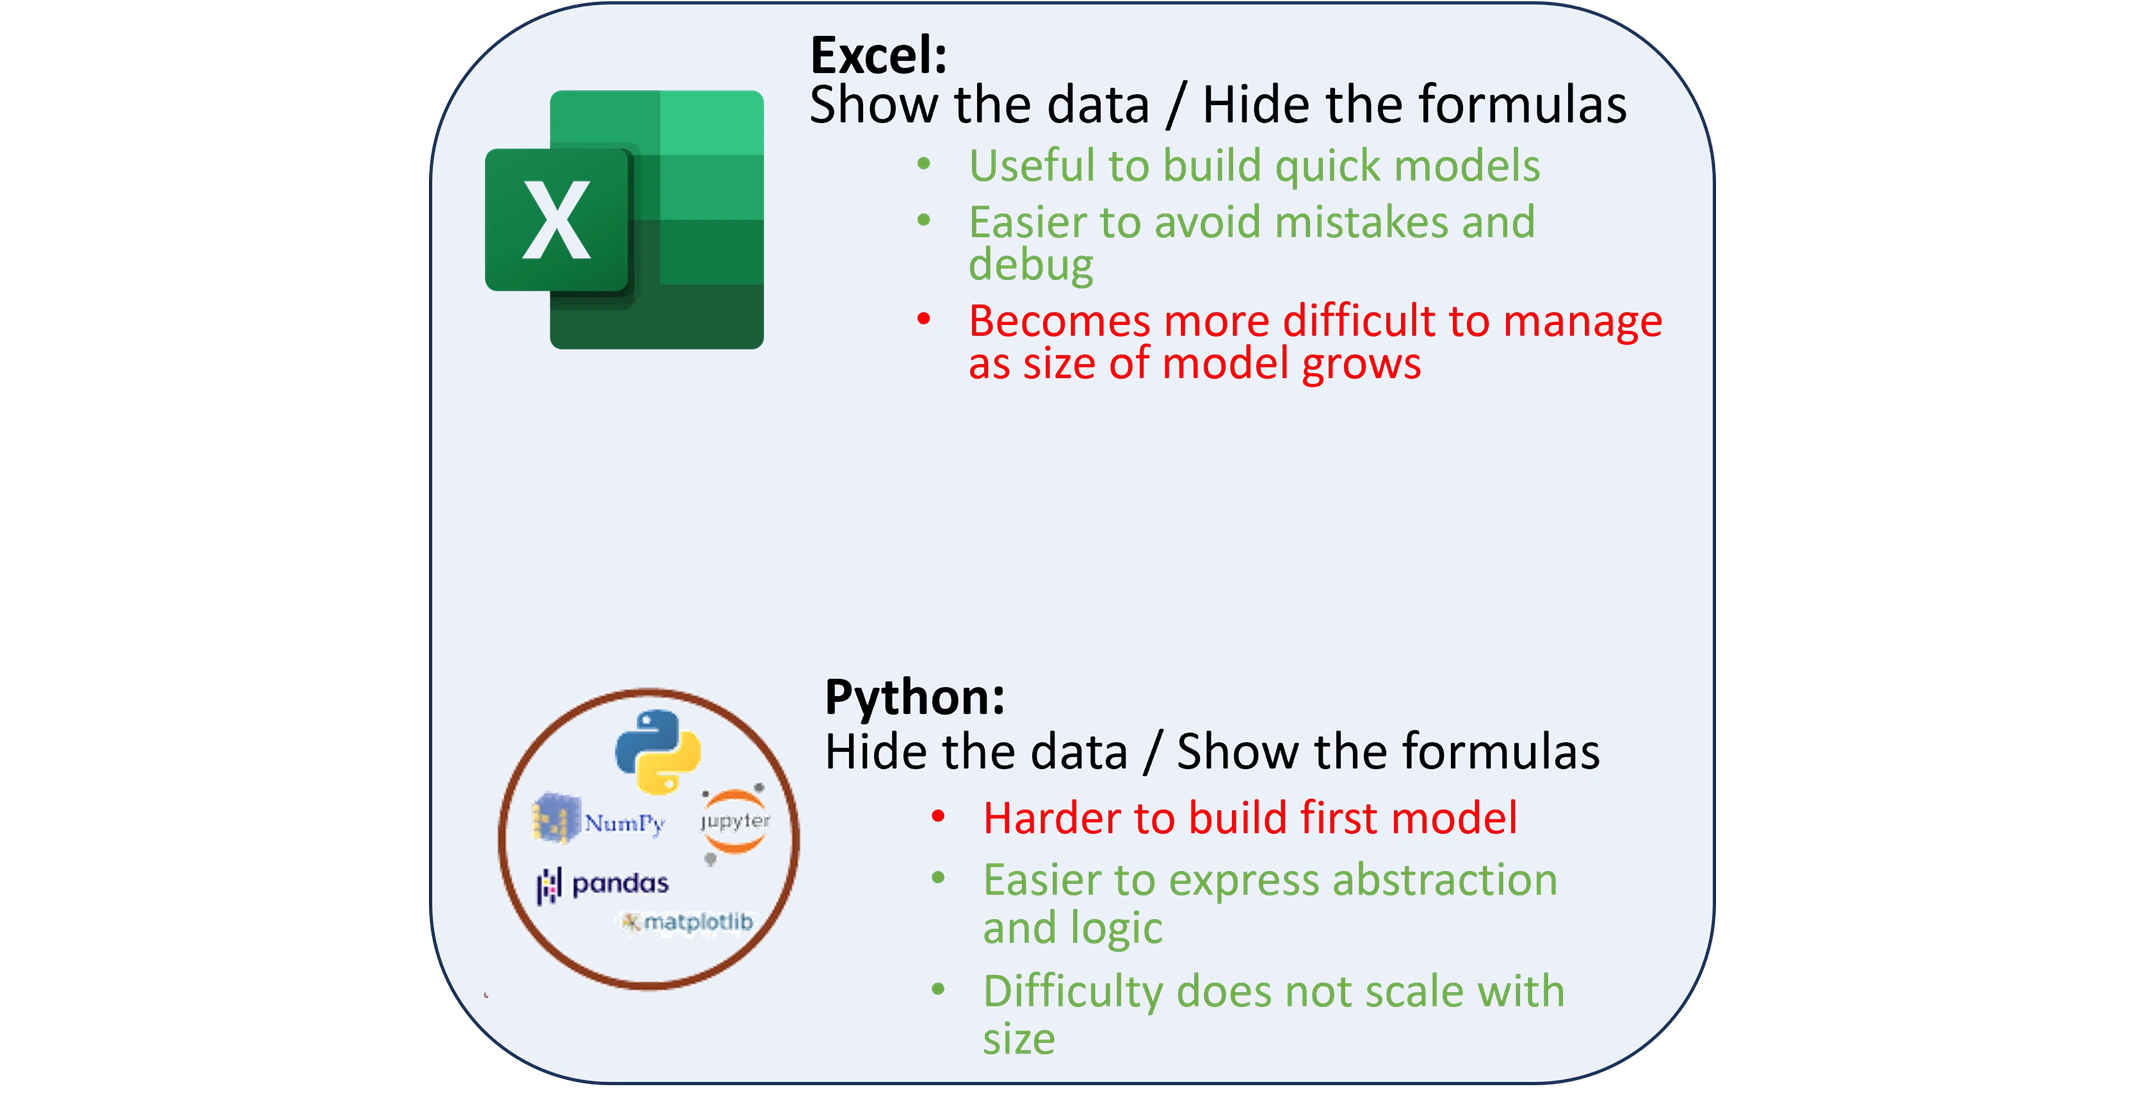
A PGM-based framework builds on the best of Excel, for business intelligence, and python for reusability/scalability.
To grasp the power of PGMs, we must first change how we view a spreadsheet. A complex Excel workbook is not a flat ledger; it is a highly structured, implicit Directed Acyclic Graph (DAG), where nodes are cells and edges are formulas.
Consider a simple formula chain:
=SUM(C4:C10) in cell C11. Cell C11 is a dependent node. The range C4:C10 are its parent nodes. If C4 contains =IF(B2>10, D1, 0), the dependencies cascade.
In the language of data science, this network of formulas, named ranges, and sheet references forms an intricate influence diagram. The entire system is already a graph, representation of logical and mathematical influence, it is just stored in an invisible, proprietary, and siloed format.
| Feature of Excel | PGM Equivalent |
| Cell Value (Input) | Variable Node (e.g., Oil Price) |
| Cell Value (Calculated) | Deterministic Node (e.g., Total Revenue) |
| Formula (=A1*B1) | Formula Between Connected Variables (Edges) |
| Named Range | Module or Sub-Graph / Group |
| Point Estimates (Single Numbers) | Probabilistic Distributions & Automatic Propagation |

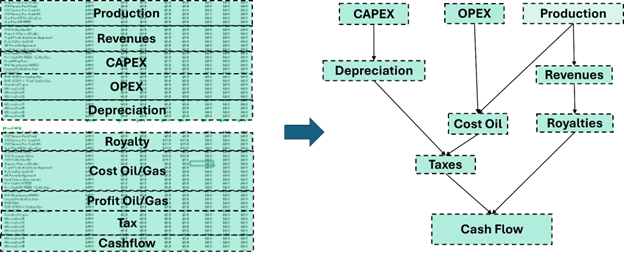
The Shift from Dense (Excel) to Sparse (PGMs) Representations
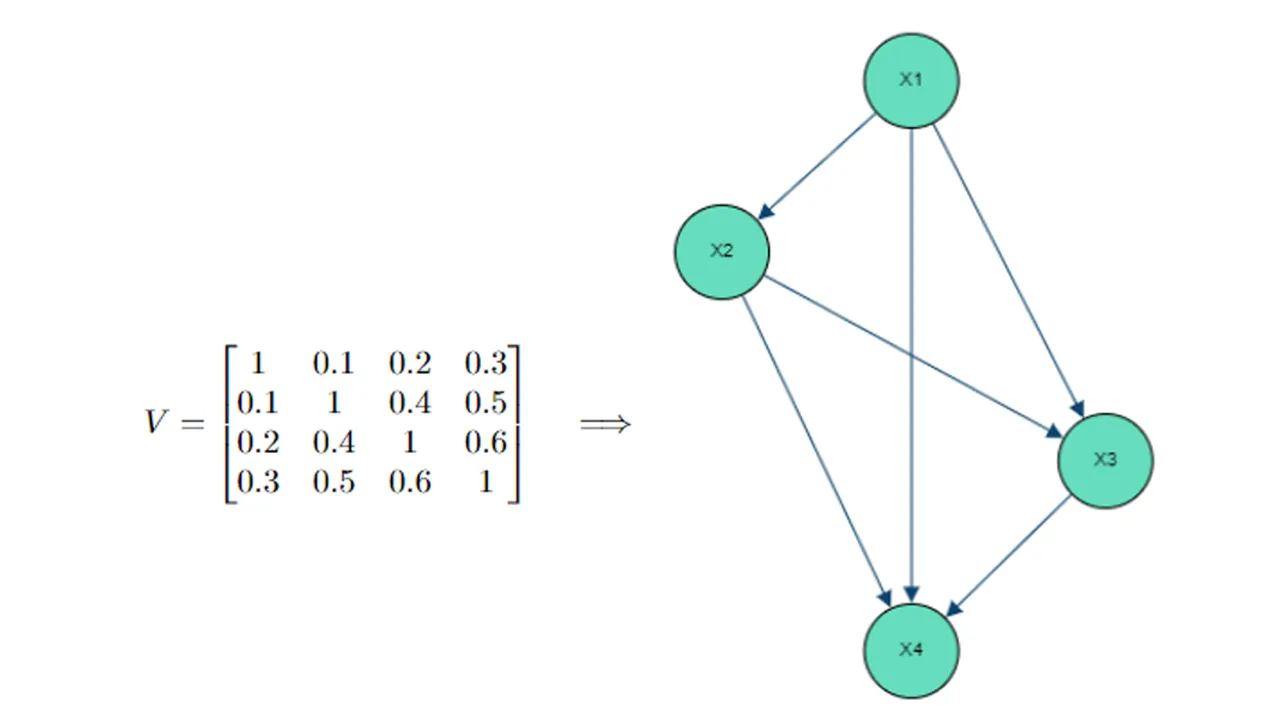
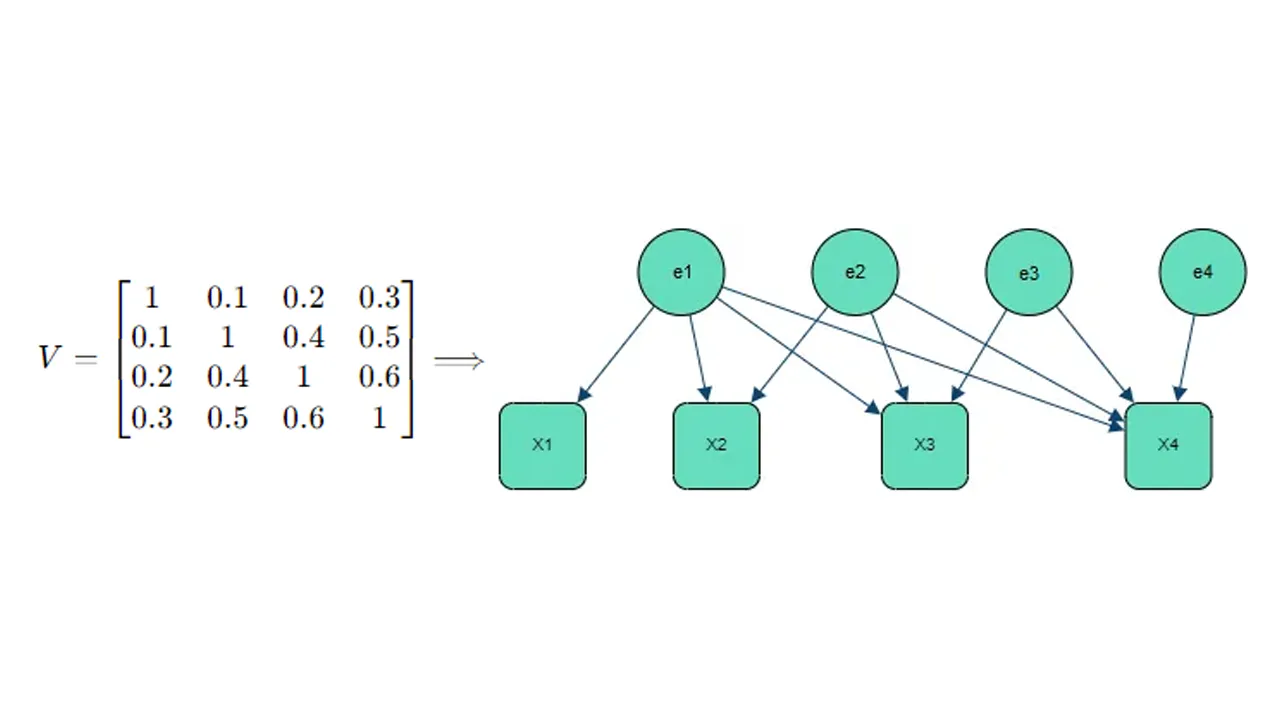
An Excel file containing a complex financial model, for instance, might involve thousands of these hidden connections. When an analyst tries to trace the impact of a change in a single input (say, the depreciation in Sheet1!$B$5) on the final output (Depreciation in Sheet5!$F$20), they are forced to manually navigate formula bars and reference trees. When that formula is repeated for various time steps, like it’s done in a cash flow model, the graph representation is said to be dense. Considering that changes could have been introduced in any cells/formulas, reviewing an Excel becomes a very tedious manual and error-prone process.
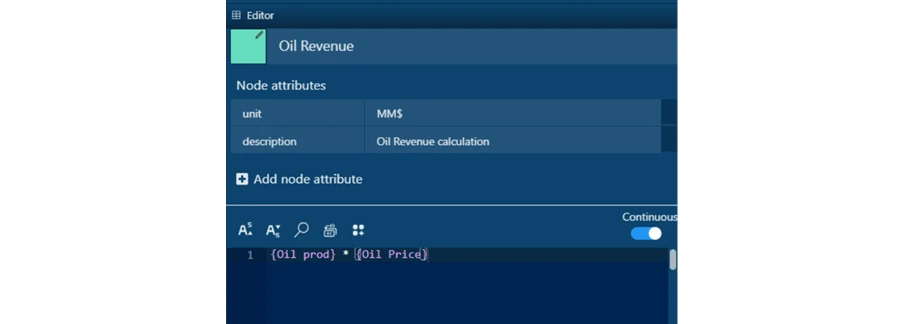
In contrast, a graph representation brings to the forefront the logical relations between the variables such as {Oil Revenue} = {Oil production} * {Oil Price} leading to a much more sparse representation of the graph.
In other words, the implicit dependency relationships of the Excel file are extracted and formalized as a graphical structure.
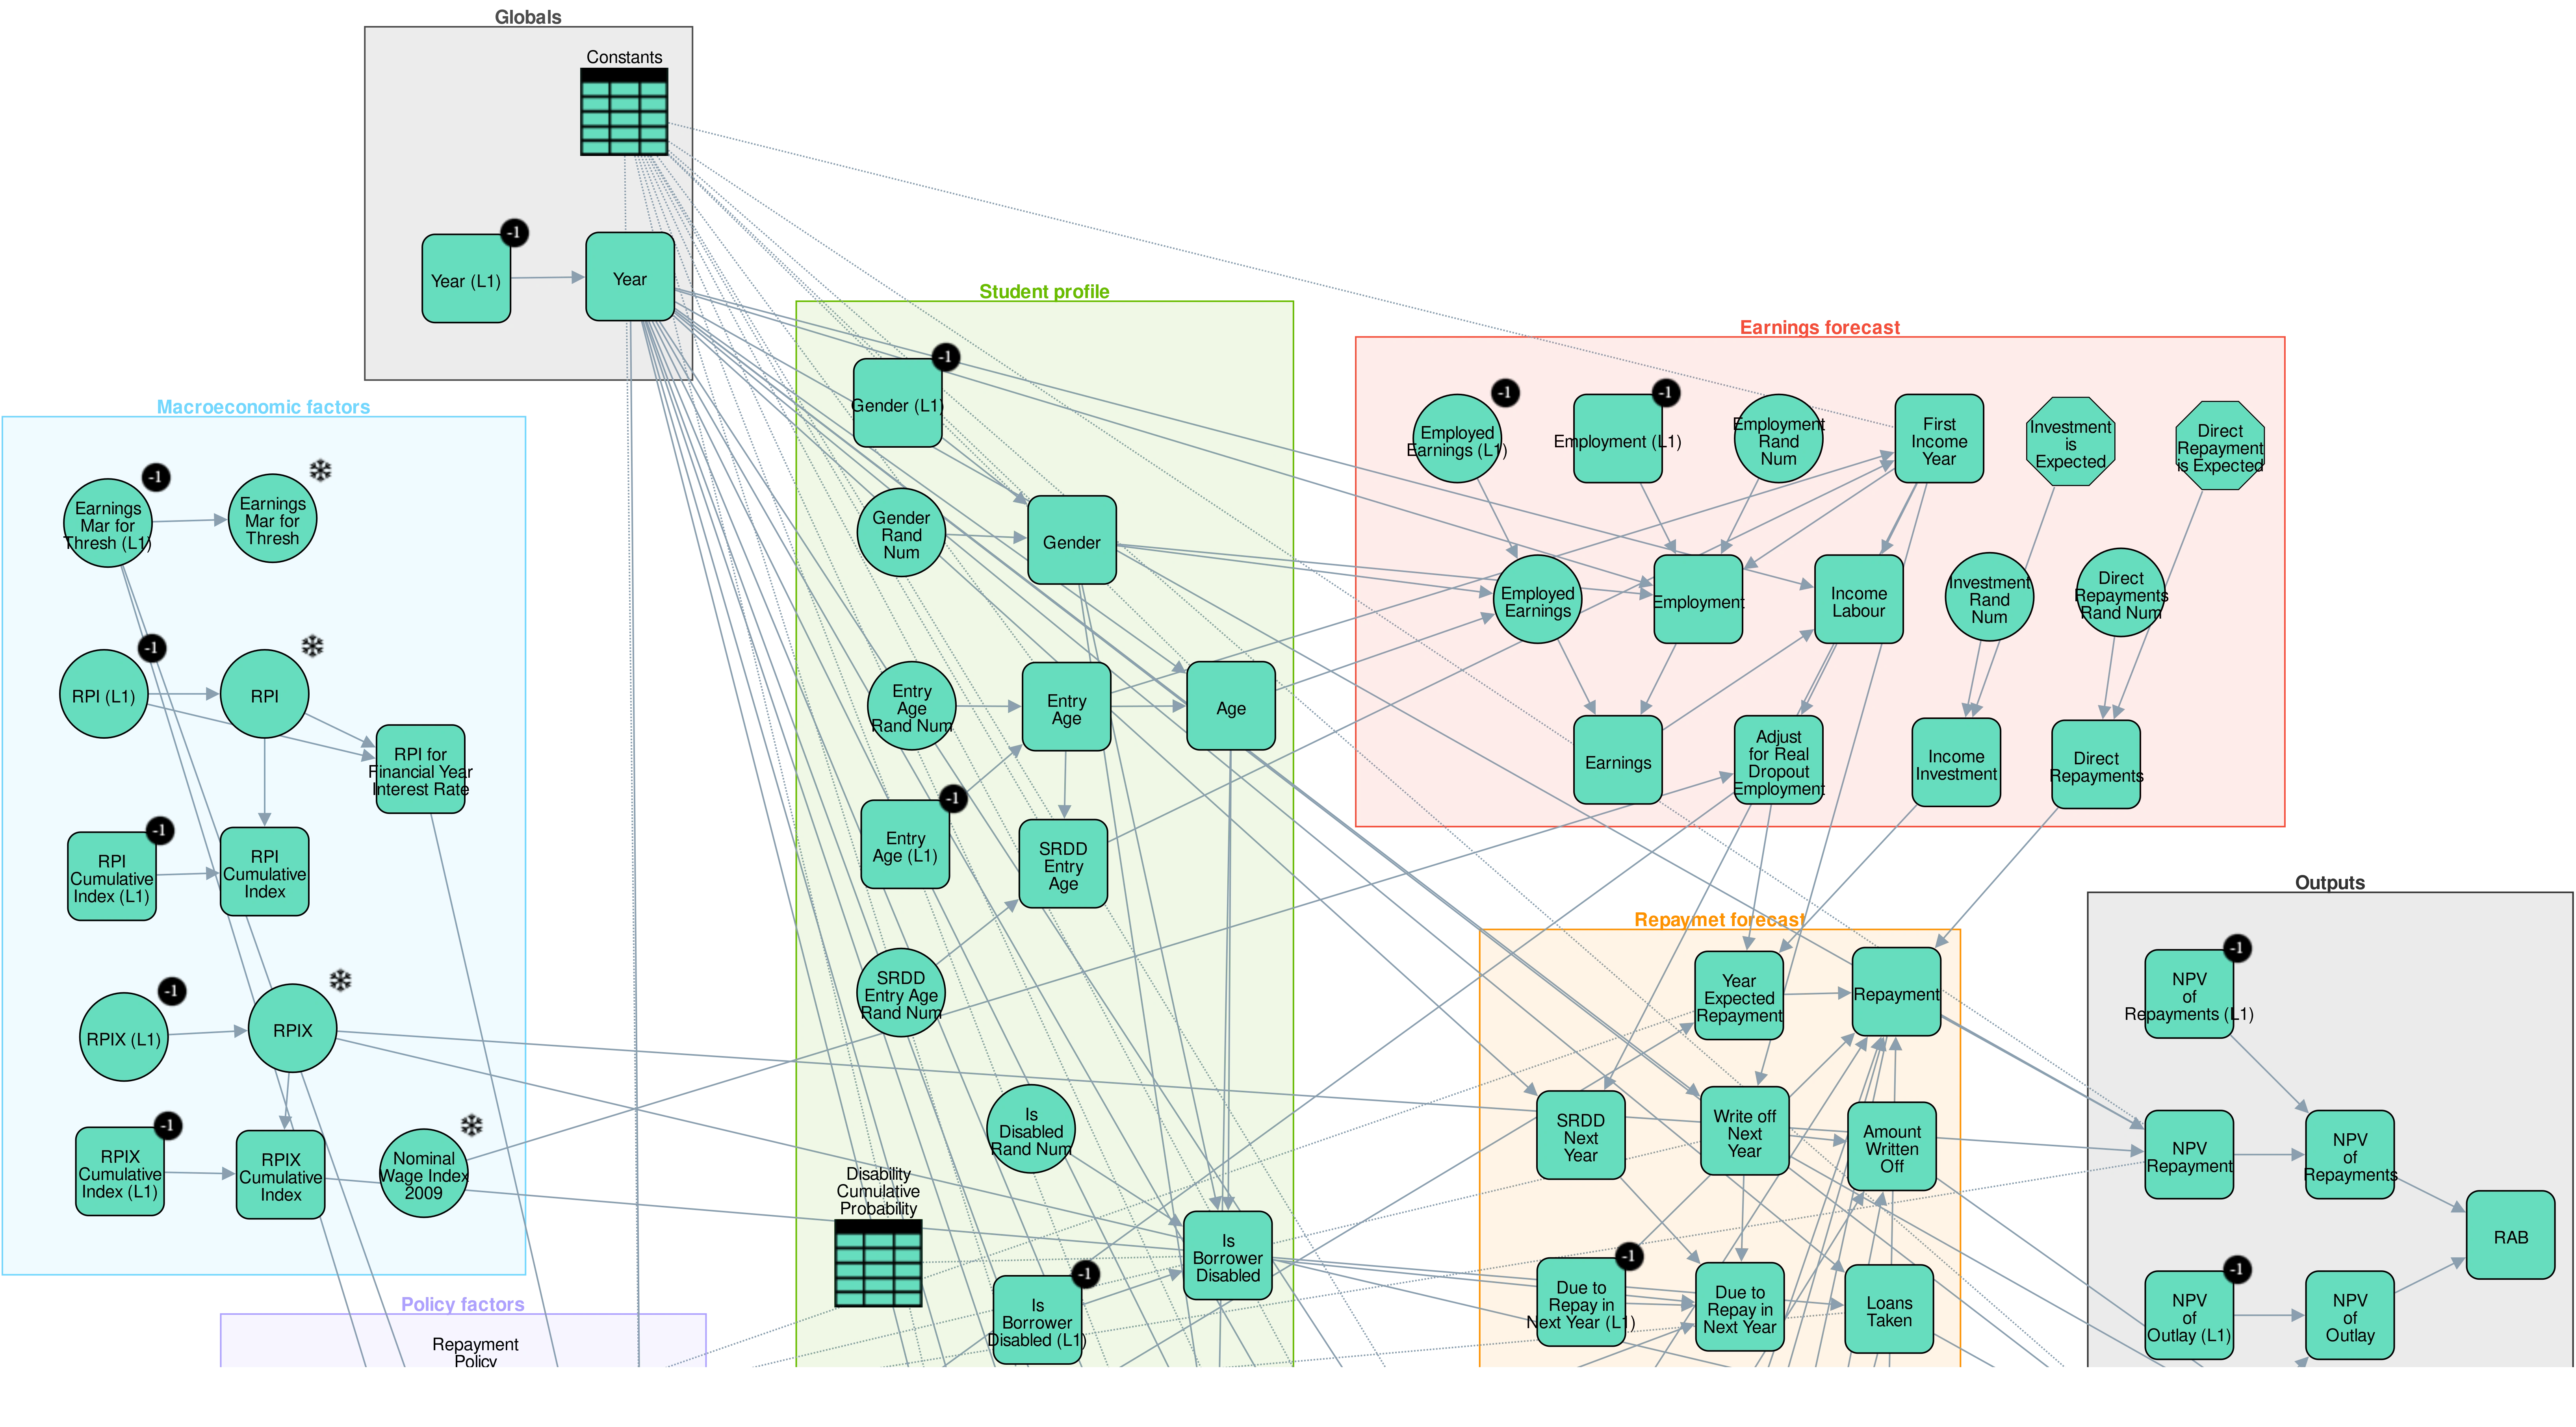
This structure is modular, allowing complex models to be decomposed into reusable components, much like LEGO bricks. An entire spreadsheet can become a single, self-contained Techno-Economic Module within a larger PGM framework to be assembled or taken apart based on modeling needs.


Once the logic of individual Excel models is translated into a unified PGM framework, the organization gains a true repository of expert knowledge, validated relationships and uncertainty distributions.
The repository achieves this by consolidating scattered, expert-driven assumptions:
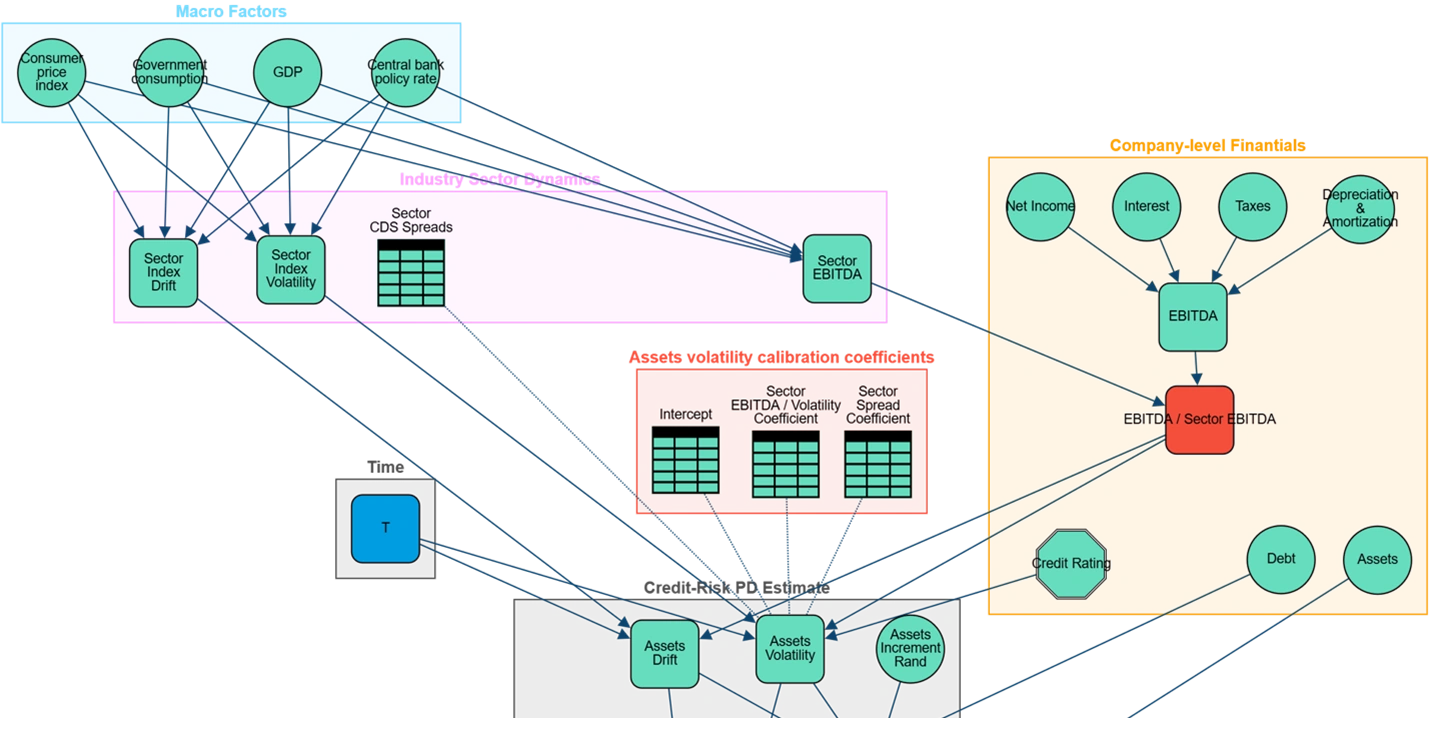
- Technical Silos: The engineering team’s model for production decline (now a Production Module in the PGM) can automatically feed into the finance team’s cash flow forecast (the Economics Module), ensuring alignment on foundational assumptions.
- Geographic Silos: Tax and regulatory assumptions for different jurisdictions, once hard-coded into separate regional spreadsheets, become reusable Fiscal Modules in the PGM. This eliminates redundancy and ensures every project in that jurisdiction uses the same validated tax logic.
- Uncertainty Silos: Probabilistic assumptions (such as the estimated P10-P90 ranges for cost, schedule, or market prices) are centralized, ensuring that every connected project uses the same corporate-approved distributions for shared risks, while allowing for clear differentiation and adjustment when project-specific risk factors warrant a customized approach.
The resulting enterprise PGM network becomes a single source of truth for all relationships and assumptions.
Analysts and leaders can now interrogate the system:
- "What assumptions are driving the 80% chance of a positive IRR for Project X?" The PGM instantly highlights the most influential upstream variables, regardless of which department owns them.
- "Show me every project that uses the corporate estimate for inflation." The knowledge repository instantly maps all dependencies to this single variable, providing immediate traceability.
- What are ways
By transforming expert judgment (expressed in Excel formulas) into modular, probabilistic, and explicit graphical components, the PGM architecture turns fragmentation into a strategic, cohesive, and auditable asset for the entire enterprise.
All models are stored, tested, version controlled as graphs into the cloud and a lightweight interface makes calls to them. While letting experts safely maintain blocks related to their expertise, the knowledge repository facilitates domain integration and debottlenecks the access and use to decision models directly improving operational efficiency.
A central tenet of this approach is that PGMs do not demand the abandonment of Excel. Instead, they require the creation of a seamless, two-way integration channel that leverages Excel’s strength (accessibility) while eliminating its weakness (siloing).
The first step for a technical modeling team is to develop a translator that extracts the dependency tree (the formulas and cell references) from key Excel workbooks and imports that logic into the PGM platform. This lift is performed once per model type (e.g., the standard cash flow template).
Excel results are then reproduced to verify the accuracy of the transfer. During this migration time, stakeholders can continue to make use of the Excel model while gaining experience with the graph model.
Once migrated, graph models enable more robust business-friendly features, helping in multiplying decision-models value:
- Version Control: Graphs version control allows to track locations, time and nature of changes made on graphs by various contributors.
- Unit Testing: Results can be tested and verified under predefined assumptions, helping identified which modifications caused what changes making the model both robust and transparent.
- A/B testing: Version control allows contributors to safely access models, modify them and quantify differences between alternate versions before deployment.
- Analytics/AI: Standardized models can be adjoined with advanced analytics facilitating the visualization and interpretation of models and alternatives solutions. Examples are the use of Sankey diagrams to visualize cash flow models or the use of AI reporting tools to give automatic executive summary results.
For enterprise adoption, the PGM cannot become a "black box" that only data scientists can query. The system must be able to export its powerful, integrated analysis back into a familiar environment: Excel.
The end-user, the business executive, can view the powerful, integrated results in the familiar spreadsheet environment, without ever having to touch the complex PGM backend. This two-way channel lowers the barrier to adoption and institutionalizes confidence in the decision intelligence.
For decades, the intelligence embedded in organizational models has been scattered, siloed, and trapped within the formulas of individual spreadsheets. The enterprise has lived with the severe limitation that it cannot easily query the total sum of its expert knowledge, leaving it vulnerable to hidden risks and blind to potential synergies.
Probabilistic Graphical Models (PGMs) offer the essential architectural upgrade. By treating the logic of Excel as the hidden graph that it is and formalizing it into a modular, probabilistic, and explicit network, PGMs create a unified knowledge repository.
The goal is not Excel’s replacement, but its amplification. Excel remains the primary interface for input and output, while the PGM engine manages the complexity, uncertainty, and interdependencies behind the scenes.
This shift delivers clear, measurable business outcomes:
- Reduced Risk Exposure: By correctly modeling correlations, organizations avoid understating the probability of tail risks.
- Improved Collaboration: Standardized logic and modular components break down silos, ensuring alignment between finance, engineering, planning and high-level executives.
- Faster Insights: The ability to instantly query and re-simulate the entire portfolio facilitates decision-readiness, allowing the firm to act proactively rather than reactively.
Embracing this framework is the next evolution in decision analytics. It ensures that complexity is no longer a barrier, but the very fuel for scalable, actionable intelligence. It is time to unlock the hidden graphs and move the organization from fragmented spreadsheets to cohesive, strategic decision networks.