De-Risking Enhanced Geothermal: Exploration, Development and Acquisition Using Probabilistic Graphical Models
The pursuit of Enhanced Geothermal Systems (EGS) is critical for the low-carbon economy, offering reliable, baseload power. However, EGS projects face inherent challenges, namely high upfront capital costs and significant subsurface uncertainty. For developers and investors, the key to unlocking this massive potential lies not in avoiding risk, but in quantifying, modeling, and managing uncertainty and risks to make better strategic decisions.
This is where Probabilistic Graphical Models (PGMs) provide a powerful, architectural shift for de-risking exploration and acquisition strategies, moving beyond traditional single-point estimates to deliver a transparent, full-spectrum view of potential outcomes facilitating transparency and success.
Conventional techno-economic models, whether simple spreadsheets or complex black-box simulations, often rely on deterministic, single-point estimates for critical variables like reservoir temperature, drilling costs, and power prices.
This approach fails to capture the true, multi-faceted nature of EGS risk in two key ways:
Siloed Uncertainty: Drilling speed rates, crew availability, operational expenditure (OPEX) overruns, permitting delays, policy changes, electricity prices and their volatility… are loosely related. Traditional models treat these factors in isolation, leading to an underestimation of true downside risks emerging from interdependency compounding effects or end-tail risks.
Opaque Logic: The complex formulas in spreadsheets often bury the dependency relationships, hindering collaboration between geologists, engineers, and financiers.
Subsurface Risks: Well understood by technical professionals, complex subsurface models often fail to be meaningfully integrated in the investment and C-suite decisions due to a lack of suitable frameworks and just plain communication barriers.
PGMs directly address these flaws by formally mapping every input and its associated uncertainty (as a probability distribution) into a cohesive decision network.
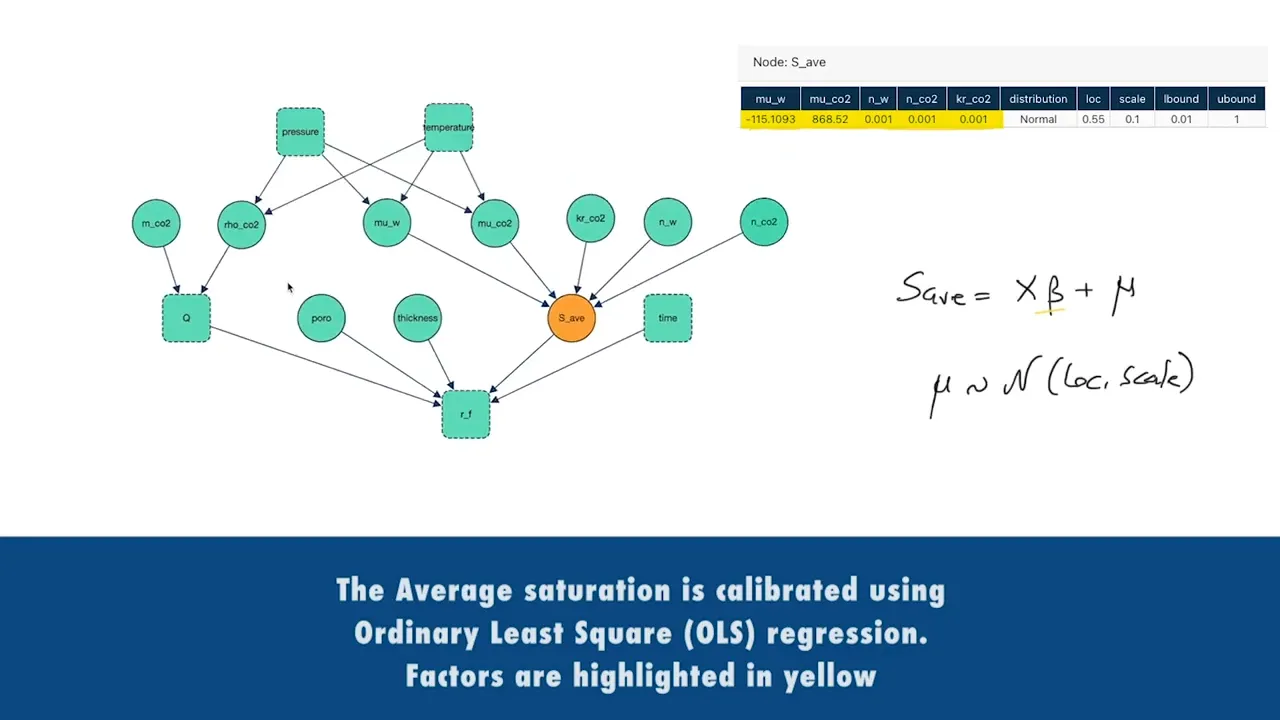
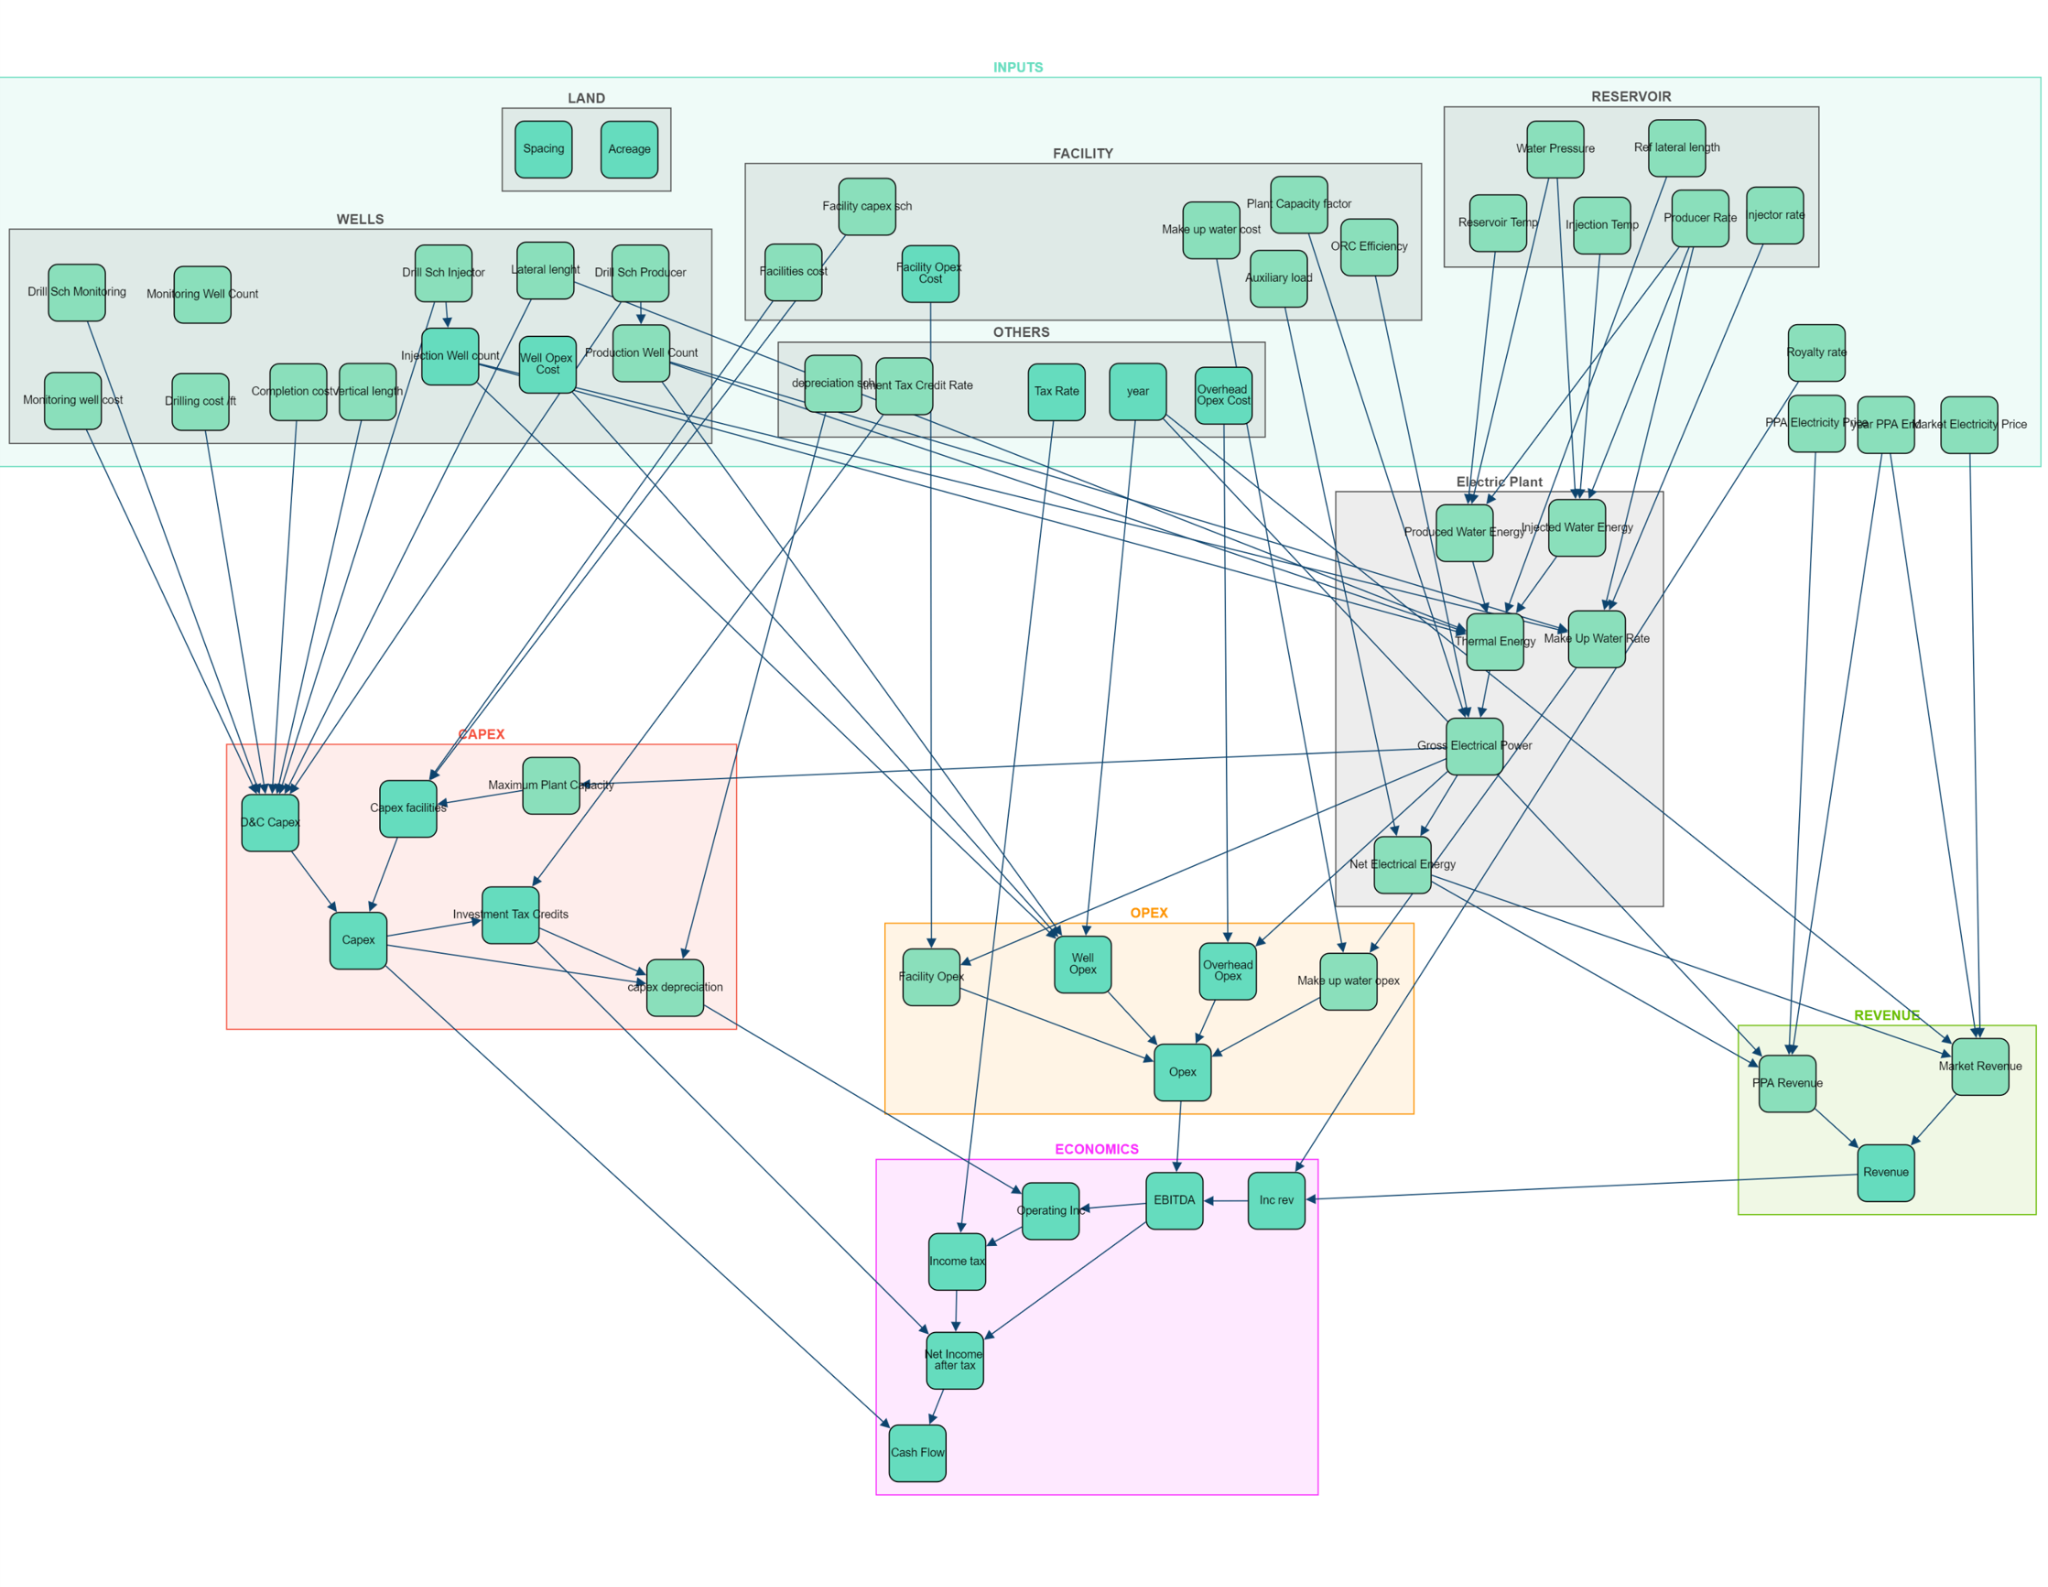
See details on EGS uncertainty model.A PGM for an EGS project is structured to seamlessly integrate technical, geological, and financial uncertainties. It formalizes the entire project lifecycle as a series of interconnected, modular steps:
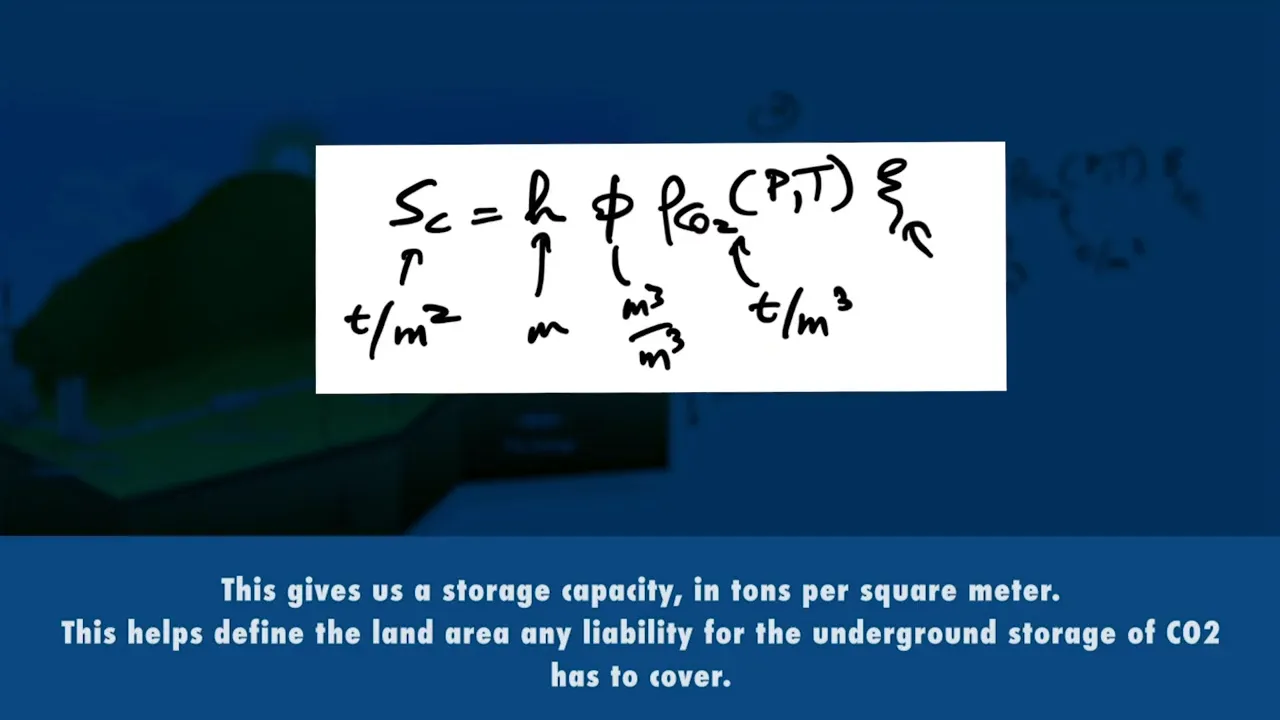
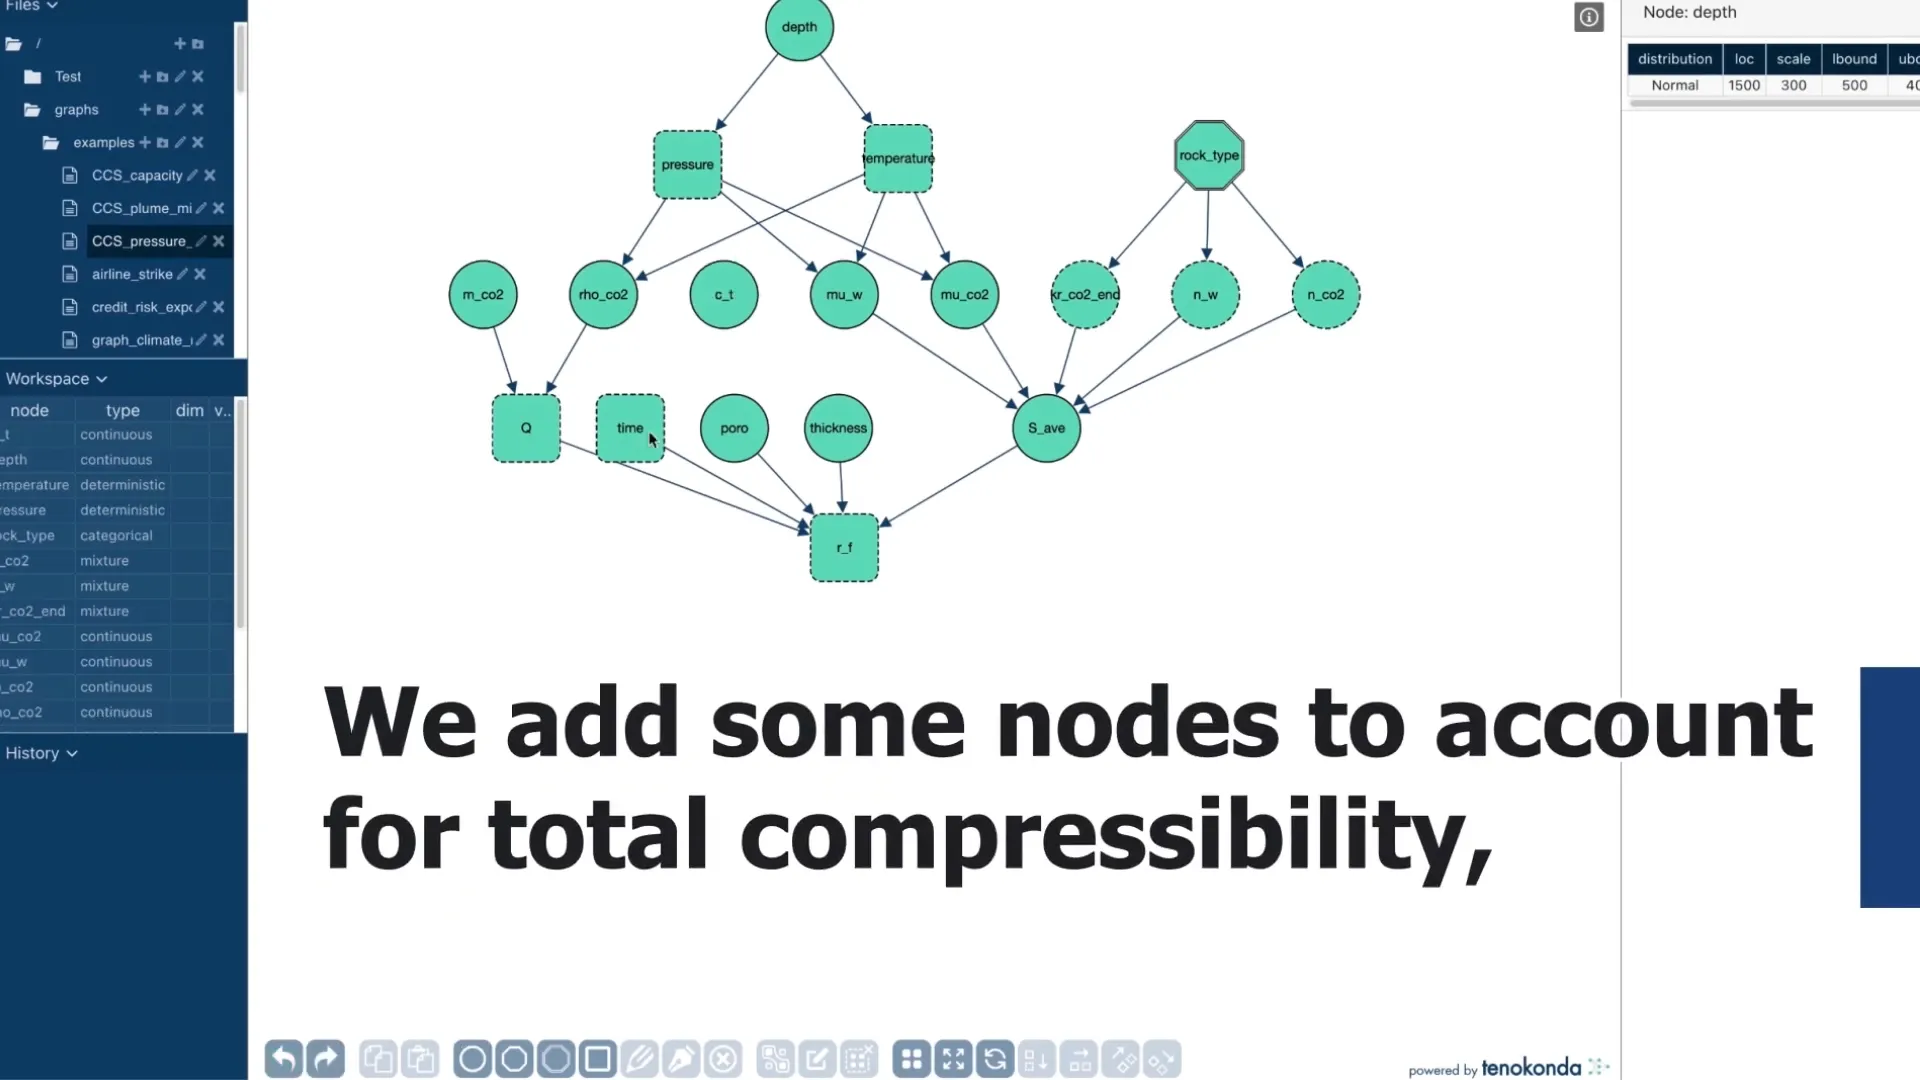
Defining Variables and Distributions: Key inputs, like Reservoir Temperature, Permeability, Drilling Cost, ORC Efficiency, and PPA Price, are represented as probabilistic nodes (variables with a range of possible values), not single numbers.
Mapping Dependencies: Edges (directed lines in the graph) explicitly define the mathematical and physical relationships between these nodes (e.g., higher Reservoir Temperature leads to higher Thermal Energy, which leads to higher Electrical Power).
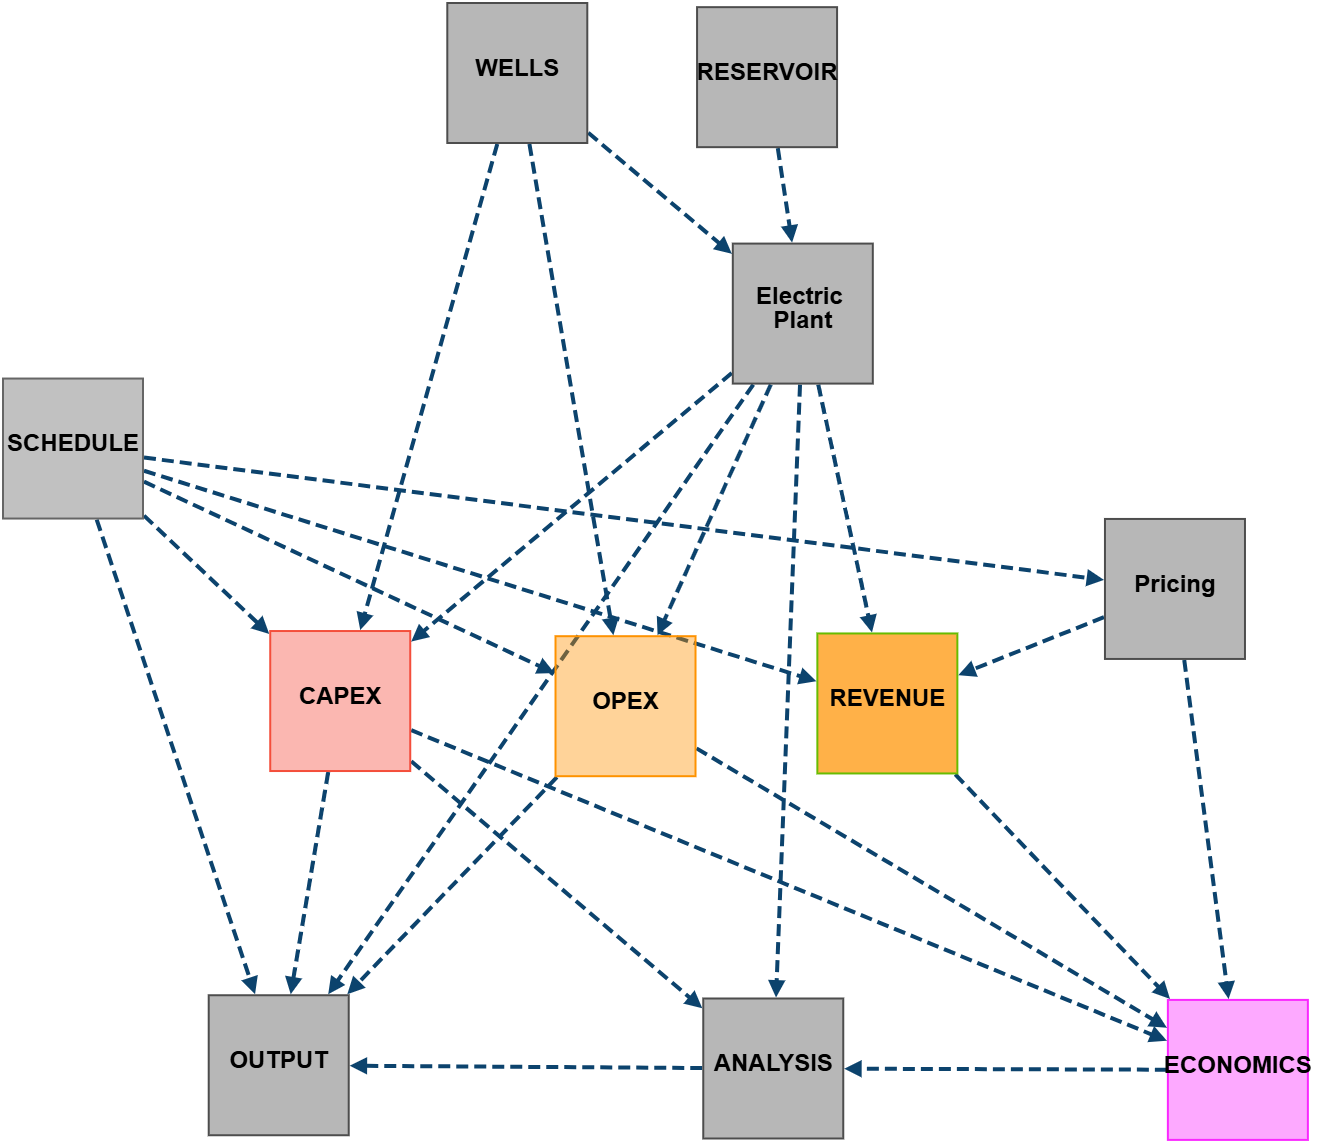
Simulating Outcomes: The PGM model is subjected to Monte Carlo simulations (running thousands of scenarios) to propagate the initial input uncertainties across the entire model. The output is not a single expected Net Present Value (NPV), but a full distribution of potential NPVs, Internal Rates of Return (IRRs), Leverage Cost Of Electricity (LCOE) and many others which are known across the exploration area but customized to location specifics data, markets and regulations.
This process results in a transparent and extensible model of the project's assumptions and interdependencies. that serves as the knowledge and uncertainties integration for all project assumptions and interdependencies.
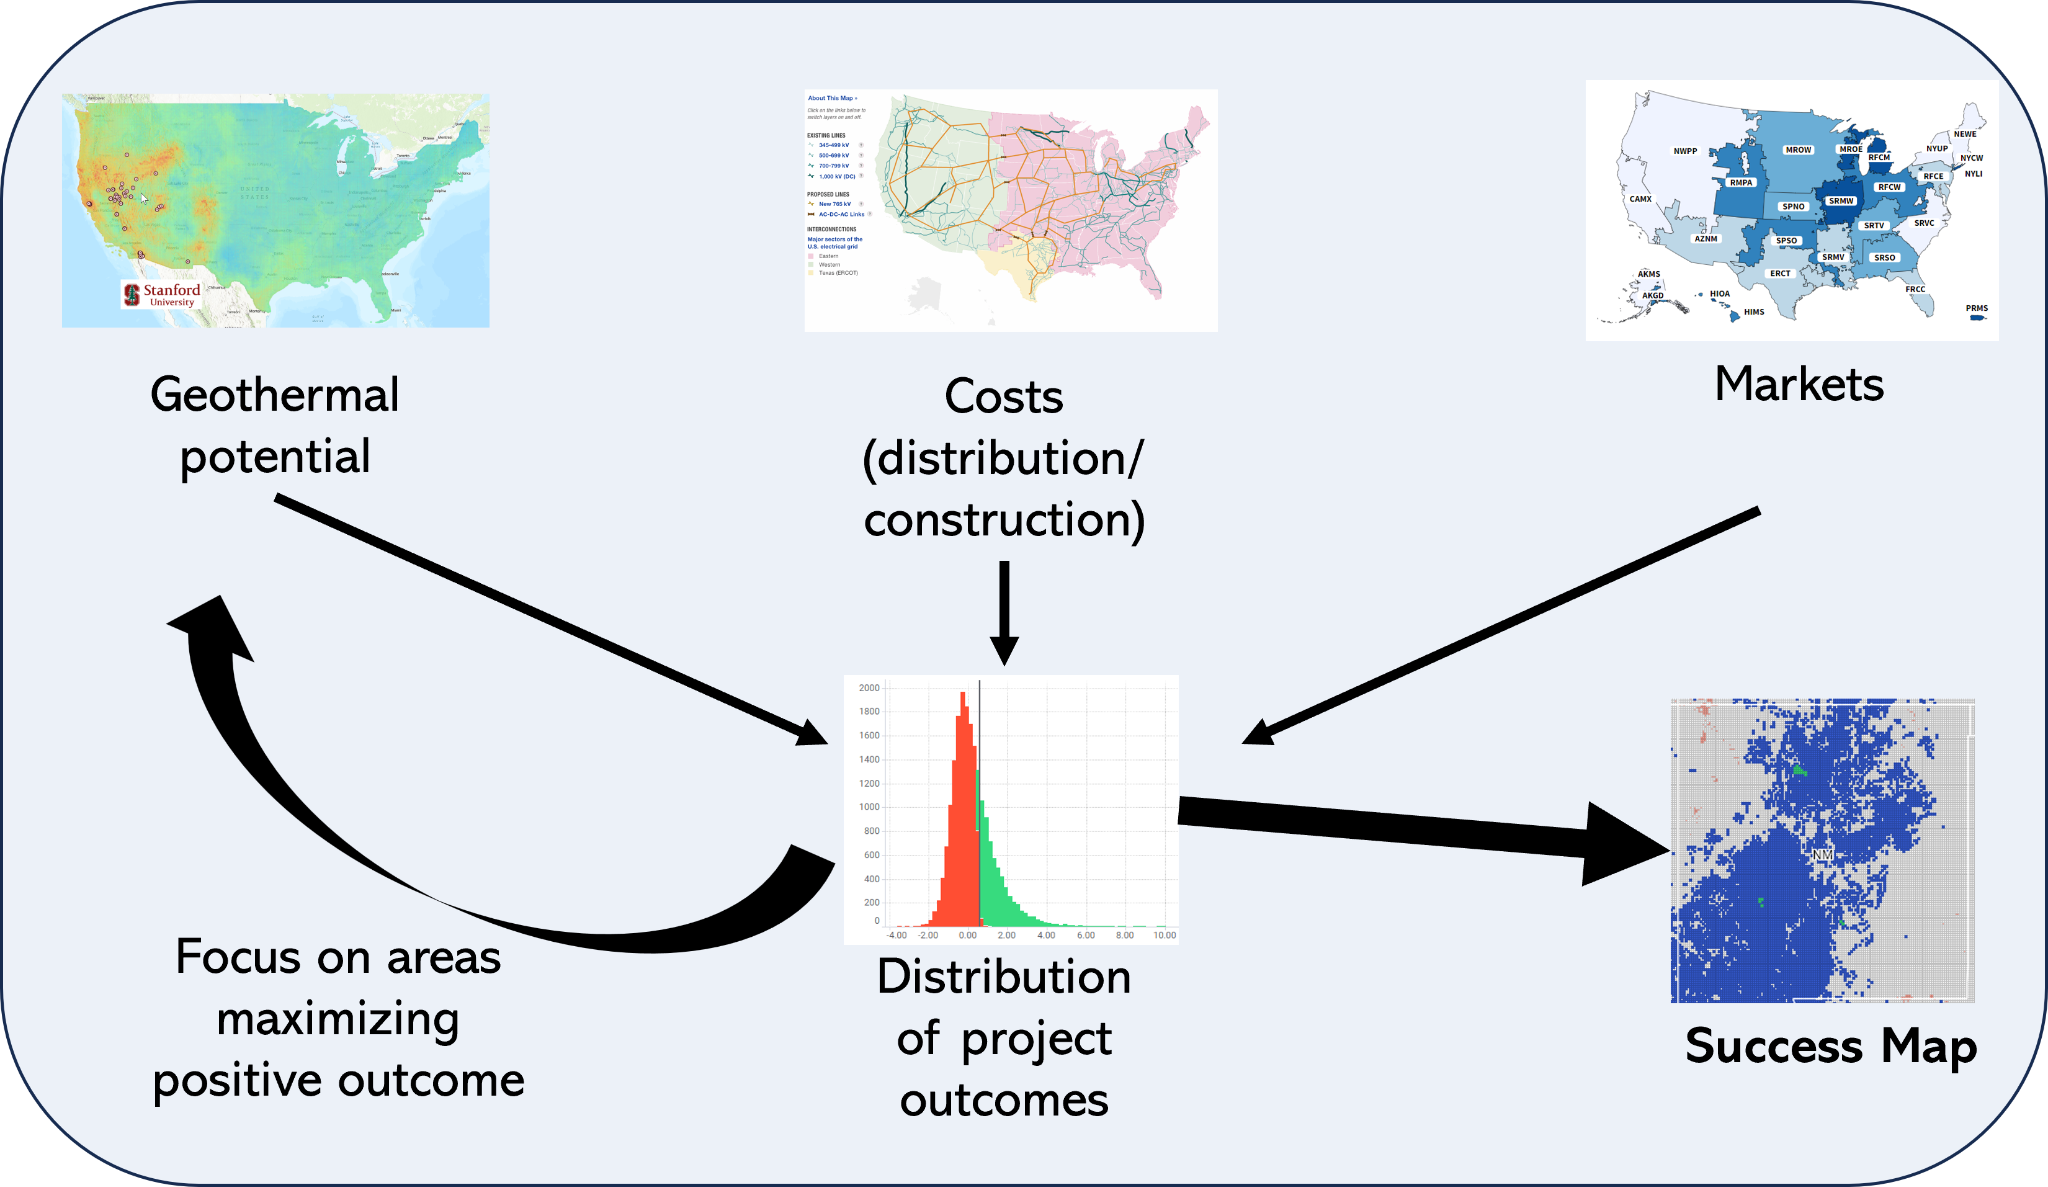
The true value of PGM-based modeling emerges when its full distribution of outcomes is applied to strategic decisions like exploration and acquisition.
PGMs allow for the direct identification of the most critical variables driving project value using techniques like sensitivity analysis.
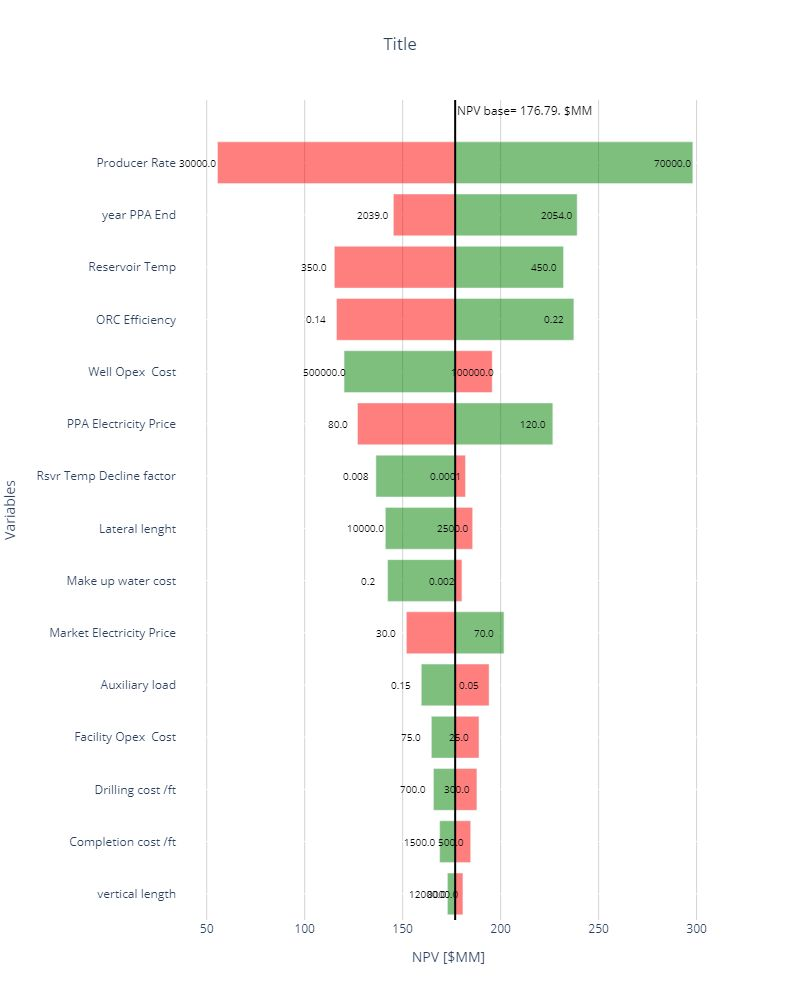
Prioritizing Data Acquisition: By determining which variables, e.g., Producer Rate, Reservoir Temperature, or PPA Price, have the largest impact on the final NPV distribution, management can strategically focus resources (capital, time) on de-risking those specific areas first. For a capital-intensive EGS project, understanding that Reservoir deliverability may be a primary swing factor allows the team to prioritize early-stage drilling or seismic acquisition to reduce the uncertainty around that node.
Visualizing Sensitivity (The Tornado Chart): The resulting tornado chart instantly maps the range of uncertainty for each input variable against the final output (NPV), immediately highlighting where adding information (i.e., exploration investment) yields the greatest reduction in risk.
Calculating Value of Information (VoI): The PGM can be used to calculate the incremental value of reducing the uncertainty range of a key variable before making the final investment decision. This tells a developer which new piece of data will have the greatest impact on reducing the overall project risk profile. Bayesian inference further enables calculation of the Value of Imperfect Information, which accounts for both prior knowledge and the actual information update resulting from the acquisition.
For acquisitions, the PGM moves beyond deterministic valuation (which might be based only on an expected-case, or P50, outcome), or ad hoc estimates to instead, model the true risk-adjusted value.
Identifying the Acquisition Price Range: By running the PGM, a buyer can calculate the full probability distribution of the target asset's NPV. This provides a data-driven range for negotiation, from a P10 (low probability/low value) scenario to a P90 (high probability/high value) scenario.
Quantifying Hidden Synergies and Anti-Synergies: PGMs can model the correlation between the acquired asset and the existing portfolio.
Synergies: If the acquired asset can share an existing transmission line or utilize the corporate tax structure, the PGM quantifies the probability distribution of that value addition, allowing the buyer to confidently factor it into the bid price.
Anti-Synergies: If the two assets rely on the same limited corporate resource (e.g., the only expert stimulation team or a drilling or completion rig or a water source…), the model can quantify the risk of a resource conflict leading to delays and value destruction.
Community integration is a non-technical risk factor that directly impacts financial outcomes through permitting delays and legal challenges during exploration or project development. PGM allows developers to quantify the financial impact of this “social license to operate.”
Quantifying Delay Cost: PGM links a binary or probabilistic “Community Pushback” node (e.g., probability of a 6-month permitting delay) directly to the Schedule/Time to First Power node. A 6-month delay can translate to tens of millions in NPV reduction due to delayed cash flows and accrued pre-development costs.
Justifying Engagement Investment: By quantifying the financial cost of poor community integration (the delay risk), the PGM justifies significant early investment in engagement, benefit sharing agreements, and local workforce development, turning these soft costs into quantifiable, de-risking CAPEX that reduces the probability distribution of high-impact schedule delays.
The PGM framework excels at modeling advanced financial and contractual strategies designed to share or reduce risk across the project’s lifecycle. By representing these strategies as modular “fiscal nodes”, developers can quantify exactly how much volatility is offloaded to partners or insurers.
Contractual Risk Partitioning: Developers can model the impact of Fixed-Price Drilling Contracts versus “Day-Rate” contracts. The PGM quantifies the premium paid for the fixed-price certainty and shows how it compresses the downside tail of the NPV distribution, protecting the project from catastrophic drilling cost overruns.
Parametric Insurance Integration: Subsurface risk is the primary barrier to debt financing. The PGM can integrate a Parametric Insurance node, where a payout is triggered if the reservoir temperature or flow rate falls below a specific threshold. This node acts as a “synthetic floor” for cash flow, allowing the model to demonstrate to lenders that the Debt Service Coverage Ratio (DSCR) remains healthy even in P10 subsurface outcomes.
Tax Equity and Credit Monetization: Under the Inflation Reduction Act (IRA), geothermal projects can often choose between ITC and PTC. The PGM allows developers to simulate both paths, identifying the “cross-over point” where production uncertainty makes the upfront ITC more attractive than the performance-dependent PTC.
Revenue Hedging and Floor-Price PPAs: By adding nodes for Off-take Agreements with floor prices, the PGM demonstrates how the project is insulated from market electricity price volatility. This “hedging node” allows the C-suite to see the trade-off: sacrificing a portion of the asymmetric upside in exchange for a guaranteed floor that ensures project bankability.
Unlike traditional “list-based” risk registers, a PGM approach evaluates risk and mitigation strategies jointly. Because the nodes are interconnected, a change in one area (e.g., successful results from a test well) automatically updates the probability distributions across the entire network.
Dynamic Strategy Tuning: Mitigation strategies are not static. If the “Exploration Results” node shows higher-than-expected permeability, the PGM can immediately quantify the reduced need for expensive “Parametric Insurance” or “Floor-Price” protections. This allows for finely tuned risk management policies where capital is not wasted on over-insuring risks that have already been partially mitigated.
Compounding Mitigations: It reveals how different strategies interact. For instance, combining a “Fixed-Price Drilling Contract” with “Parametric Subsurface Insurance” might create a synergistic effect on the project's P90 NPV that is greater than the sum of its parts. The PGM identifies these optimal “risk-mitigation portfolios.”
Real-Time Policy Updating: As the project moves from exploration to development, the “Policy Node” can be updated with real-world data. This transforms the model from a static planning tool into a dynamic operational dashboard, enabling the management team to adjust contractual and financial strategies in real-time as uncertainties are resolved.
By adopting the PGM-enhanced framework, energy companies integrate data into a unified knowledge repository. This provides the foundational clarity and a roadmap to make resilient, capital-allocation decisions in the uncertain and complex geothermal project development space, positioning EGS as a more bankable and competitive energy worthy of investments.