Portfolio Optimization for Energy Infrastructure Investment Under Uncertainty
The electricity sector faces concurrent demand acceleration and supply constraints. Demand growth stems from artificial intelligence computing infrastructure, data centers, transportation electrification, and industrial process heating. Supply response is constrained by transmission capacity limitations, permitting timelines extending multiple years, and the intermittency characteristics of weather-dependent renewable generation.
Traditional project-level evaluation proves insufficient for strategic capital allocation in this environment. Individual projects, regardless of merit, cannot address system-level reliability requirements. Portfolio-based approaches that explicitly model complementarity and interdependence among assets become necessary.
This analysis presents a framework for energy infrastructure portfolio optimization that integrates probabilistic modeling, dependency mapping, and multi-objective optimization to support capital allocation decisions under uncertainty.
Energy projects are characterized by multiple uncertain attributes that determine financial performance:
Capital Requirements. Capital expenditures reflect construction risk, supply chain dynamics, and site-specific conditions. For geothermal projects, costs may range $4,000-$7,000/kW depending on drilling outcomes. Operating costs vary with fuel inputs, labor markets, and maintenance requirements. End-of-life obligations include decommissioning and site restoration.
Physical Performance. Nameplate capacity provides incomplete performance specification. Capacity factor, dispatchability, and degradation determine actual energy delivery. A 100 MW solar facility in Arizona may generate 200 GWh annually with 0.5% annual degradation. A 50 MW geothermal plant may deliver 400 GWh consistently but faces reservoir depletion over 30-year horizons.
Revenue Structure. Power Purchase Agreements provide price stability over 15-25 year terms at the cost of upside capture. Merchant exposure offers higher potential returns but introduces price volatility. Observed wholesale price ranges span negative pricing to $1,000/MWh within single markets.
Temporal Dependencies. Development timelines create sequence dependencies. Projects commissioned in different years face different tax incentive regimes. Early projects may secure favorable interconnection positions while later projects face curtailment risk.
Regulatory Environment. Tax structures, renewable credits, carbon pricing, and permitting requirements vary by jurisdiction and evolve over project lifespans. Policy changes affect multiple projects simultaneously, creating portfolio-level correlations.
These attributes exhibit substantial correlation. Drilling depth correlates with reservoir temperature, affecting both capital requirements and capacity factors. Grid constraints impact multiple regional projects. Policy modifications cascade across technology classes. Conventional spreadsheet approaches inadequately capture these multidimensional dependencies.
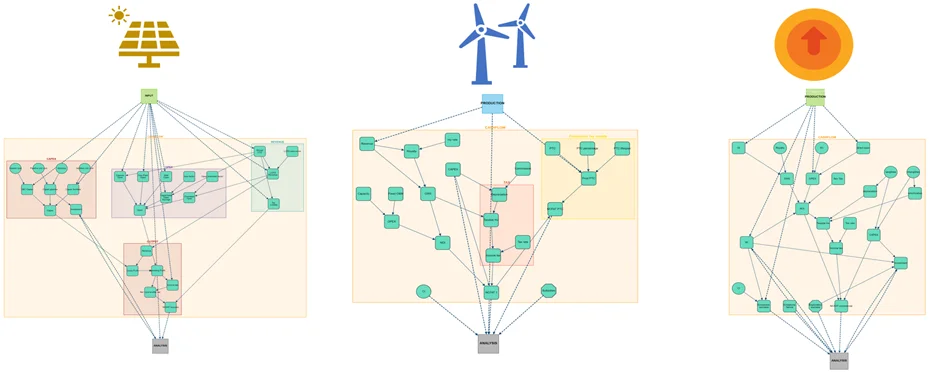
Portfolio analysis requires explicit representation of project interdependencies. This necessitates constructing influence networks rather than physical topology diagrams.
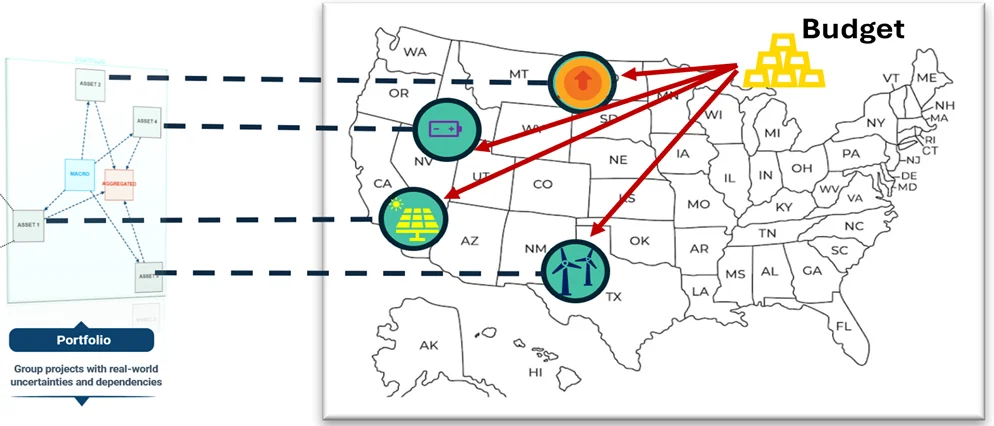
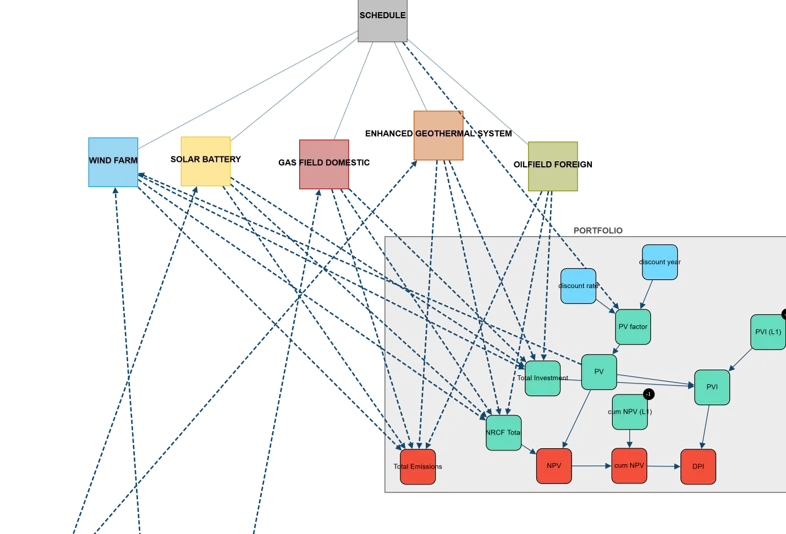
Consider four Nevada projects: solar generation, geothermal generation, battery storage, and transmission infrastructure. Dependencies include:
- Solar and geothermal projects depend on transmission permitting schedules
- Battery economics depend on solar generation patterns and demand profiles
- Investment tax credits affect all generation project financing
- Utility rate structures influence project-specific interconnection costs
These represent causal relationships determining project viability, not electrical connections. In graphical representations, projects become nodes and dependencies become directed edges. This structure reveals optimization opportunities: if transmission delays occur, battery storage enabling local solar utilization may warrant acceleration.
The distinction between influence graphs and grid topology merits emphasis. Grid diagrams show electron flow through transmission infrastructure. Influence graphs show how decisions, policies, and market conditions propagate through investment portfolios.
Optimal portfolios exhibit strategic complementarity where asset characteristics offset individual weaknesses while amplifying collective strengths.
Baseload-Intermittent Pairing. Geothermal provides constant output with limited flexibility. Solar generates during daylight hours. Combined operation enables round-the-clock supply with geothermal compensating for solar intermittency. This creates qualitatively different products commanding premium power purchase agreements.
Generation-Storage Integration. Wind generation often peaks during low-demand periods. Co-located battery storage captures surplus generation for dispatch during peak-price intervals. Combined assets can participate in ancillary services markets (frequency regulation, voltage support) inaccessible to individual components.
Geographic Distribution. Concentrated solar capacity exposes portfolios to regional weather patterns and transmission constraints. Geographic distribution across regions with different resource characteristics and grid dynamics reduces correlation risk.
Technology Diversification. Portfolios dependent on single incentive structures (e.g., solar investment tax credits) face concentrated policy risk. Technology mixing across different incentive regimes (geothermal, wind production tax credits) provides policy resilience.
Timeline Staging. Staggered commissioning dates smooth capital deployment, reduce construction risk concentration, and enable learning transfer from early to later projects.
Modern Portfolio Theory´s efficient frontier concept extends to energy systems with domain-specific adaptations. The frontier represents portfolio configurations offering maximum expected return for specified risk levels.
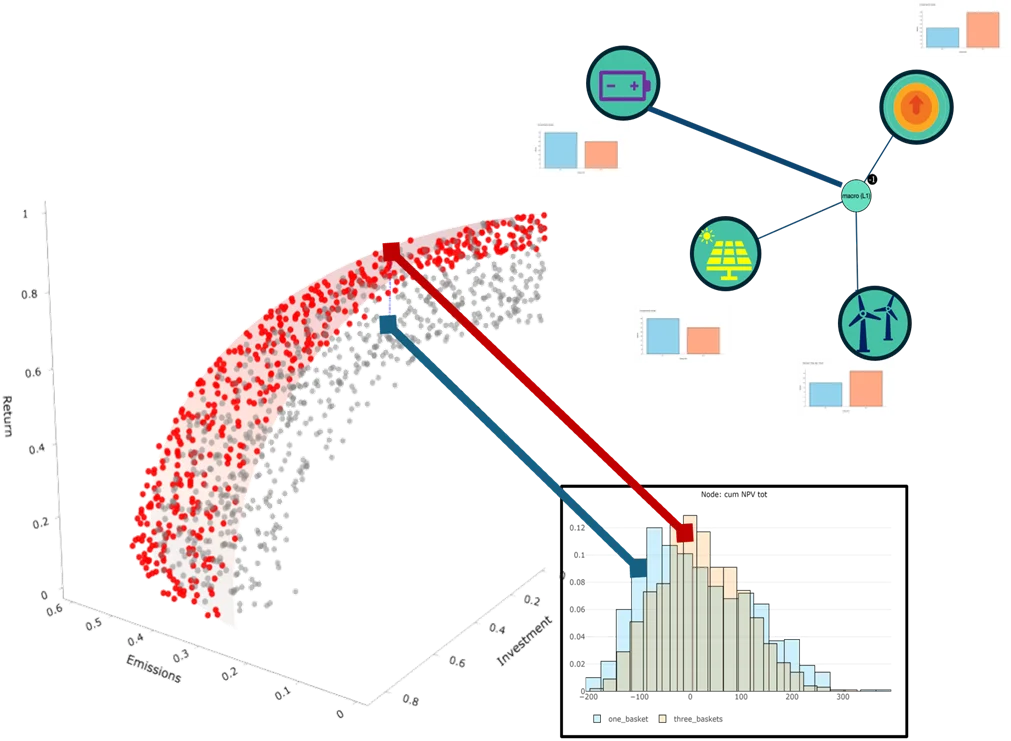
For energy portfolios, the framework incorporates multiple dimensions:
Economic Performance. Expected net present value versus cash flow volatility. Portfolios emphasizing merchant-exposed solar may exhibit high expected returns with substantial downside risk. Portfolios with contracted baseload capacity show reduced upside with improved worst-case outcomes.
Environmental Constraints. Carbon pricing regimes and renewable mandates impose emissions intensity limits. The frontier incorporates value, risk, and environmental footprint simultaneously. Some economically superior portfolios may prove environmentally infeasible.
Operational Requirements. Grid operators specify capacity factors and dispatchability requirements. Portfolios optimized solely for financial returns may fail operational mandates. The frontier identifies configurations satisfying technical requirements while maximizing financial performance.
Capital Constraints. Available funding determines feasible project sets. At $5B funding, certain configurations become accessible; at $2B, the feasible set contracts. The frontier shifts with budget variations, revealing capital efficiency relationships.
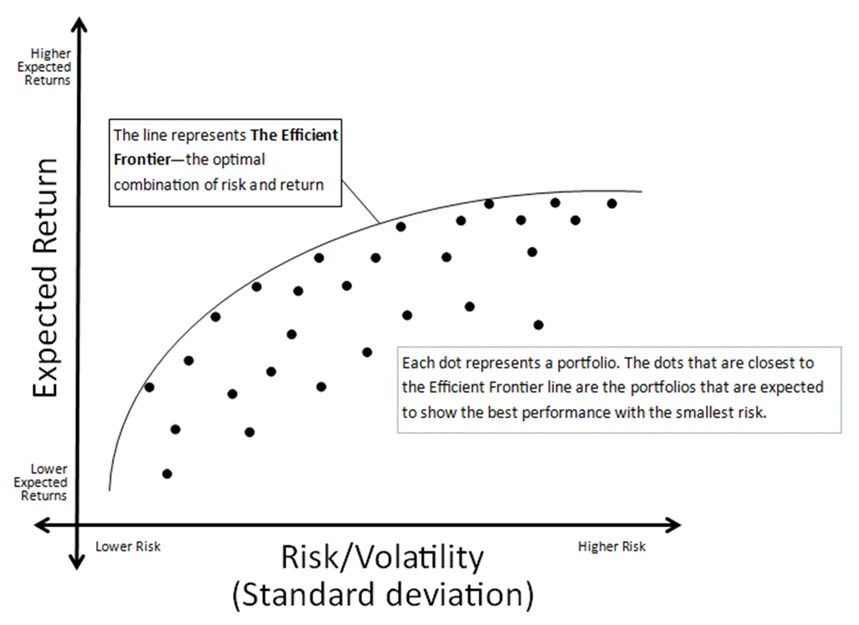
Frontier generation requires simulating thousands of portfolio configurations with full uncertainty propagation. Portfolios cluster into regions: aggressive (high return, high volatility), balanced (moderate both), conservative (lower return, lower risk). Decision-makers select positions matching institutional risk preferences.
Portfolio optimization scale exceeds manual analysis capacity. For 50 candidate projects with binary inclusion decisions, the solution space contains 250 ≈ 1015 possible portfolios. Adding capacity sizing and timing variations expands the space exponentially.
Monte Carlo Simulation. For each portfolio configuration, generate 10,000+ scenarios by sampling from input variable distributions (capital costs, capacity factors, prices, policies). This produces complete NPV distributions rather than point estimates.
Multi-Objective Optimization. Simultaneously optimize expected return, volatility, emissions targets, and budget constraints. Algorithms employ genetic programming or mixed-integer methods to identify Pareto-optimal portfolios.
Constraint Satisfaction. Encode hard limits as mathematical constraints: minimum baseload capacity, maximum annual capital deployment, carbon intensity thresholds. These constraints prune the feasible solution space.
Sensitivity Analysis. Test portfolio robustness to assumption variations. Assess performance if tax credits expire, natural gas prices increase 50%, or renewable energy credit values decline. This identifies robust versus fragile configurations.
Output comprises multiple frontier-spanning alternatives with detailed metrics: expected NPV, percentile outcomes, carbon intensity, capital requirements, and key sensitivities. Human decision-makers select from this solution set incorporating factors beyond algorithmic quantification: strategic alignment, stakeholder preferences, organizational risk appetite.
Portfolio optimization extends beyond initial construction decisions to ongoing management as conditions evolve:
Information Updating. Early project results inform subsequent decisions. Lower geothermal well temperatures than anticipated may indicate delay, redirection, or recognition of site-specific anomalies rather than systematic error. Probabilistic models enable Bayesian updating with new data.
Policy Response. Regulatory changes (e.g., Inflation Reduction Act provisions) alter project economics. Portfolio re-optimization with updated incentive structures identifies revised optimal configurations.
Market Evolution. Wholesale price movements affect merchant versus contracted project attractiveness. Portfolio rebalancing—constrained by existing commitments—captures changing market conditions.
Technology Learning. Industry experience narrows cost and performance distributions. Technologies appearing high-risk initially may become routine. Model updates with observed learning rates modify optimal allocation.
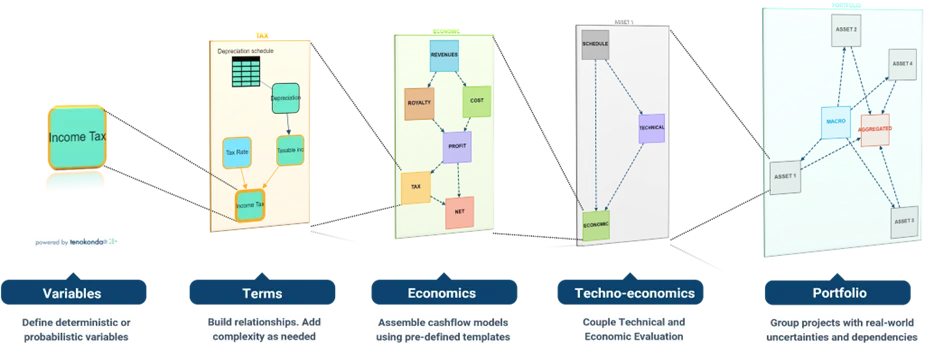
Portfolio-based approaches require systematic implementation:
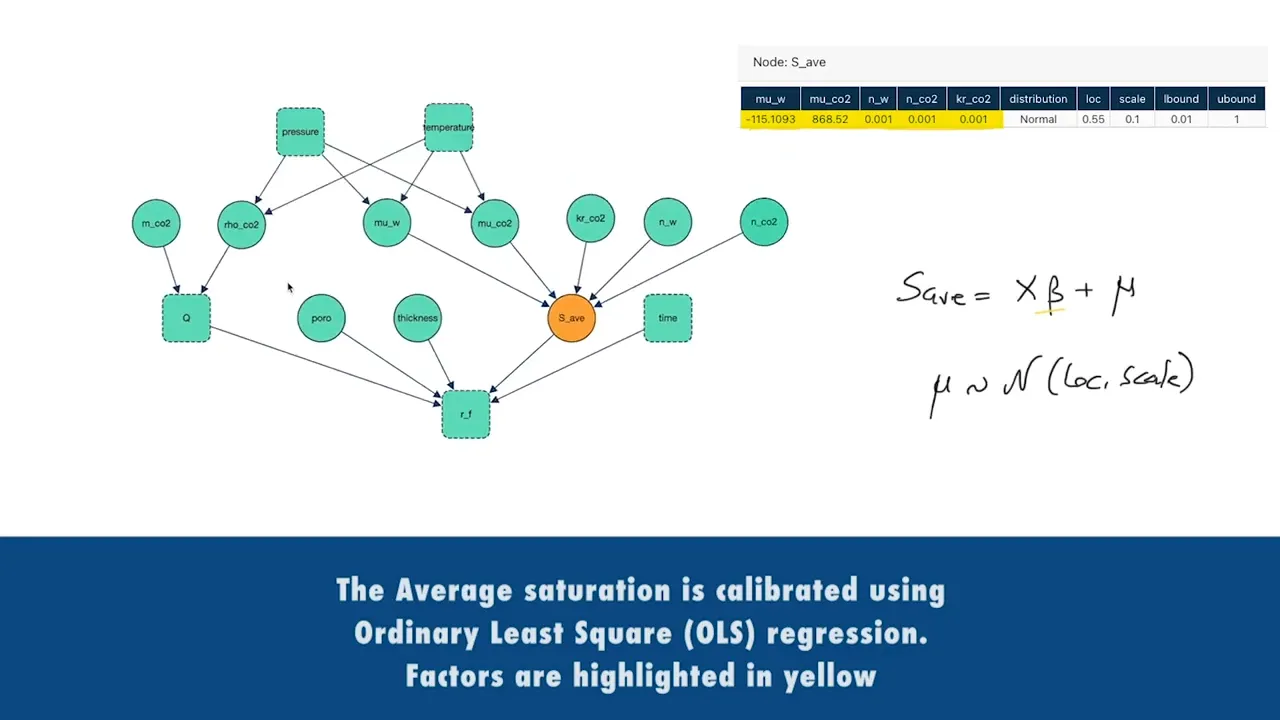
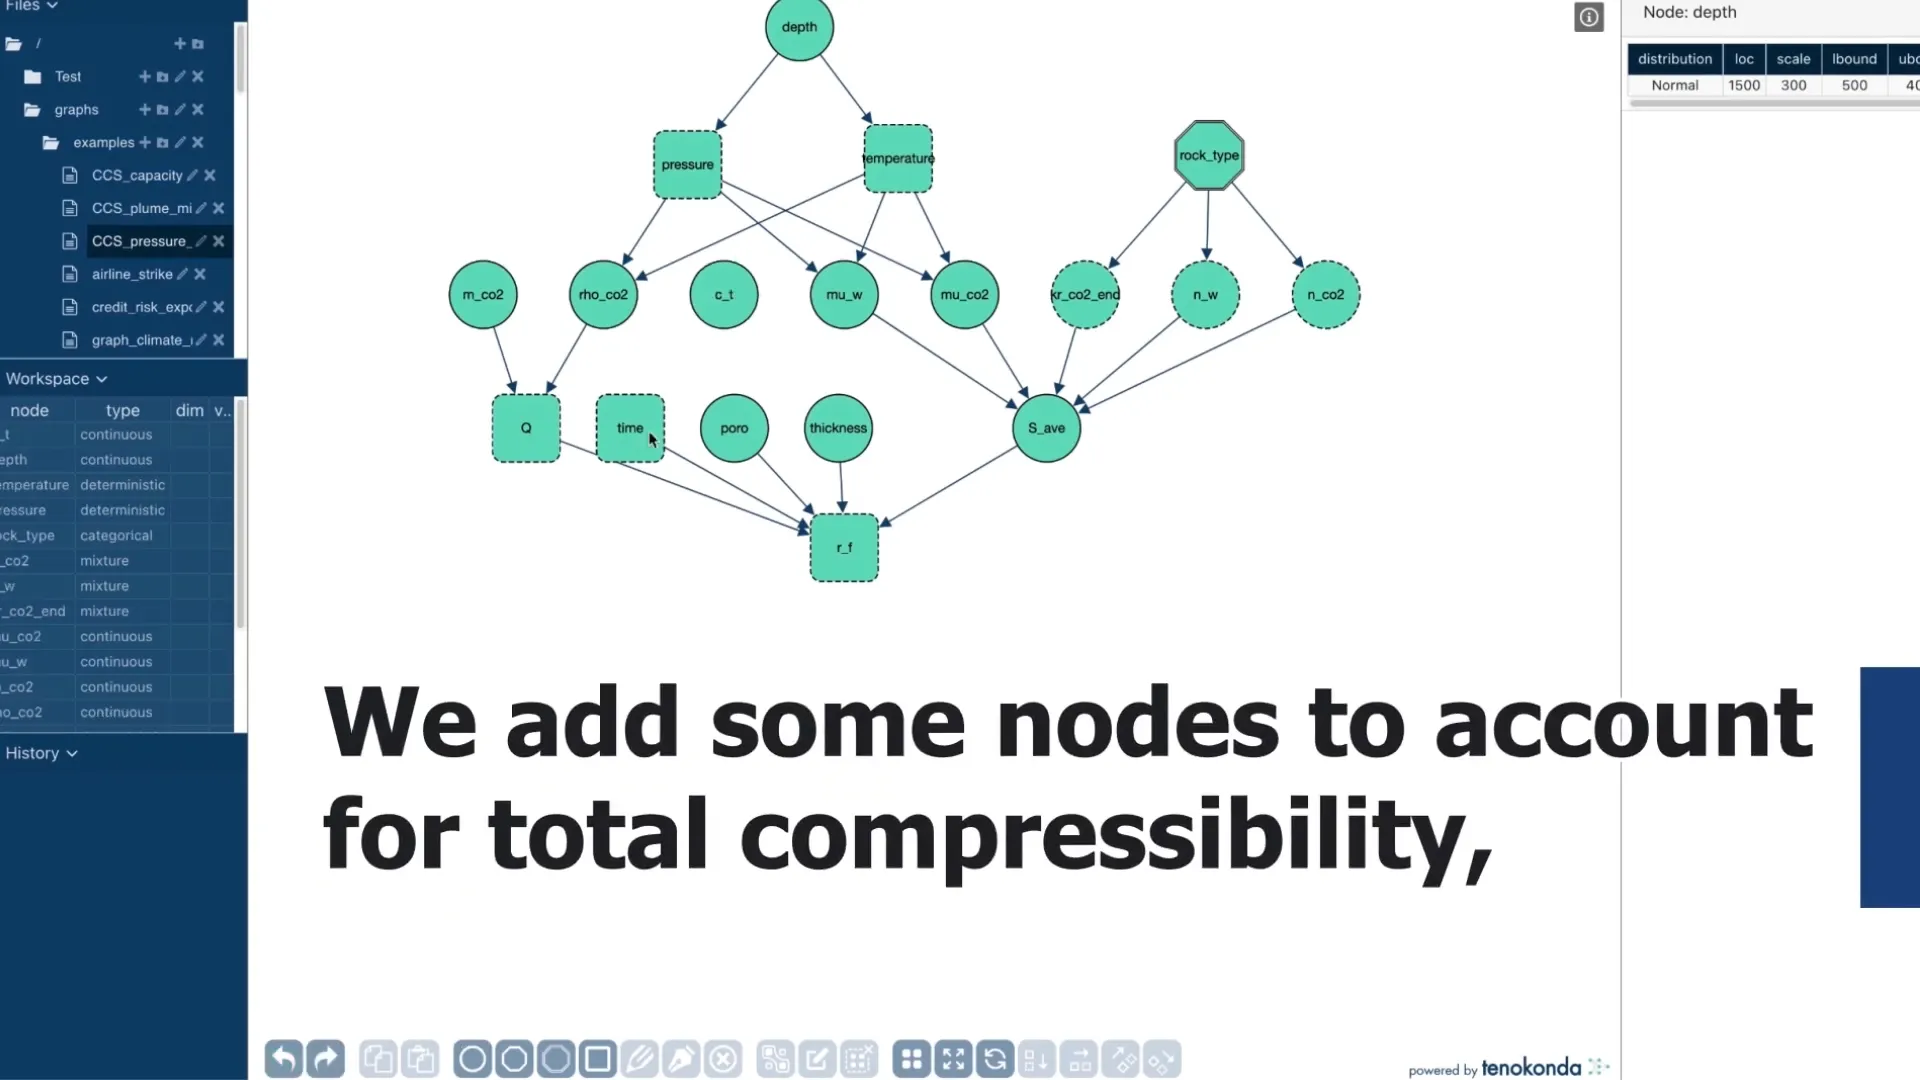
Asset Characterization. Develop probabilistic models for candidate projects. Replace single-point estimates with uncertainty distributions parameterized from historical data, engineering studies, and expert elicitation.
Dependency Mapping. Identify and quantify inter-project relationships. Determine shared infrastructure, common policy dependencies, and capital competition. Express relationships as graphical structures.
Constraint Definition. Specify hard limits (budget, capacity requirements) and soft objectives (target returns, risk preferences). These guide optimization algorithms toward feasible and desirable solutions.
Scenario Generation. Execute Monte Carlo simulations across portfolio configurations to generate performance distributions. This process is computationally intensive, often requiring substantial computing resources.
Frontier Identification. Process simulation results to identify efficient frontier. Visualize trade-offs between competing objectives.
Decision Support. Present alternatives to decision-makers with clear performance metrics. Selection balances quantitative optimization with qualitative strategic considerations.
Continuous Monitoring. Update models as projects progress and conditions evolve. Re-run optimization periodically. This transforms one-time analysis into ongoing decision support.
Energy infrastructure investment requires moving beyond sequential project evaluation toward systematic portfolio allocation frameworks. The challenge resembles strategic resource allocation under uncertainty: decision-makers must place capital across multiple projects, each characterized by distinct risk-return profiles and interdependencies.
This framework enables quantitative assessment of alternative investment strategies. Each project represents a distinct allocation option with measurable characteristics:
- Value distributions spanning P10-P90 outcomes under uncertainty
- Intrinsic risks arising from project-specific geology, engineering, and operations
- Macro risks from policy changes, market conditions, and systemic factors
- Correlation structures linking projects through shared dependencies
Decision-makers allocate capital by evaluating these dimensions simultaneously. A solar project may offer high expected returns but substantial policy risk. A geothermal project may provide lower upside with reduced macro sensitivity. Battery storage may derive value primarily from correlation with intermittent generation. The optimal allocation balances these characteristics across the portfolio.
The methodology supports multiple optimization objectives. Organizations may prioritize risk-adjusted returns, carbon intensity constraints, capital efficiency, or combinations thereof. The framework identifies portfolio configurations satisfying specified criteria—effectively measuring the risk-return profile of each investment strategy before capital commitment.
This approach transforms capital allocation from intuitive project selection to systematic portfolio optimization. Rather than sequential approval of individual projects, organizations evaluate comprehensive investment strategies. The analysis reveals which project combinations create value through complementarity, which dependencies introduce correlated risks, and how macro factors propagate through the portfolio.
For energy infrastructure organizations, this represents a fundamental shift in decision architecture. Strategic capital allocation requires frameworks that explicitly model uncertainty, capture interdependencies, and optimize across multiple objectives. Organizations adopting these methods gain systematic advantage in identifying superior investment strategies and avoiding correlated risk exposures.
The tools and methodologies exist. Implementation determines competitive positioning in capital-constrained energy markets where analytical sophistication directly translates to risk-adjusted returns.