COVID-19 Vaccine Response - I
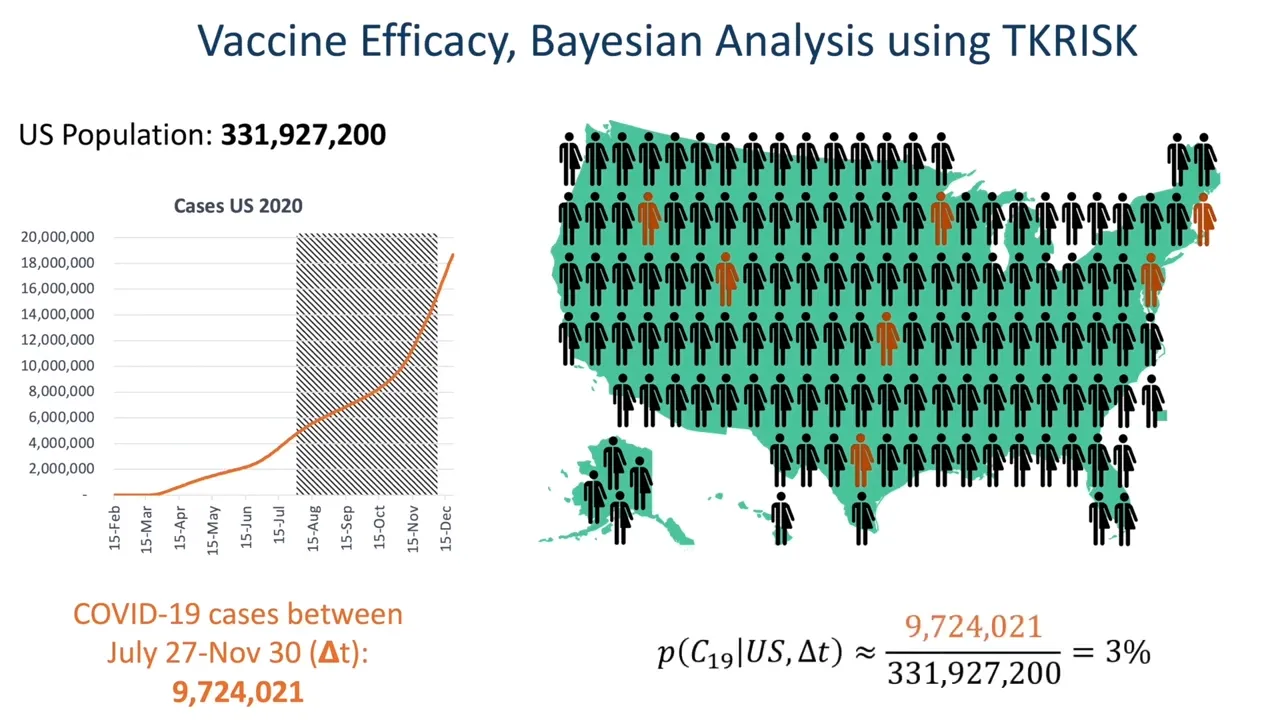
In this tutorial we demonstrate how one can use TKRISK to analyze vaccine response to COVID-19. We create a simple model of contamination and show how vaccine and exposition can jointly affect the probability of being infected.
We review with this example the logic and applicability of Bayesian networks. We are able to closely match the analytical solution thanks to efficient sampling methods including low discrepancy sequences. This is the first of a three parts demo.
Let us see how one can use TKRISK to analyze COVID-19 vaccine scenarios.
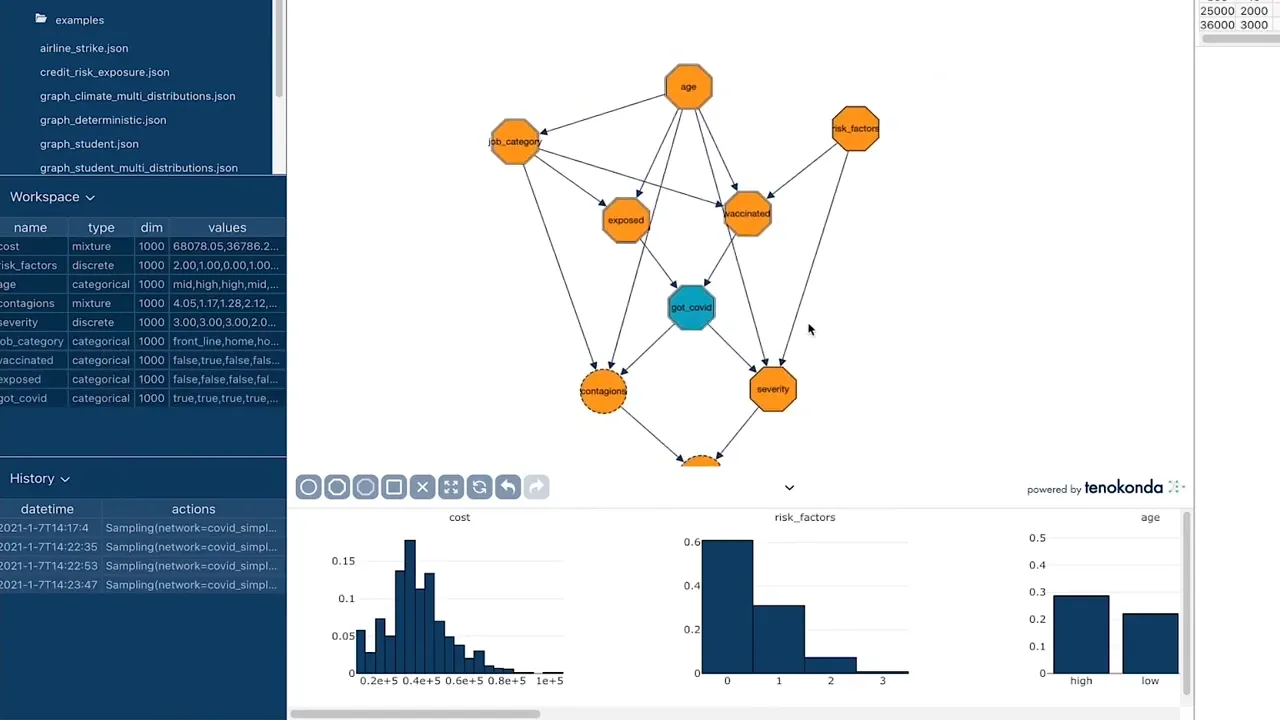
We will demonstrate that with the TKRISK interface. We can start by building a simple network that we will call “COVID simple “
We start with a central categorical node called “Got covid” that can take two outcome: true or false with a 50% chance each of happening. Let's now add another categorical node called “exposed” or being exposed or not to the virus and again its value can be true or false. And we add the third node called “vaccinated” that can be true or false. Now getting covid is dependent on 2 conditions: being vaccinated or not and being exposed or not so we draw connections between “vaccinated” and “got covid” and “exposed” and “got covid”.
Let us now see how the logic of the PGM is implemented in TKRISK and how we can parameterize it with very simple hypothesis. Let us assume we have a 30% chance of getting exposed to the virus, a 50% chance of getting vaccinated, and if exposed, you have a 50% chance of getting infected if not vaccinated, while 10% of getting infected if vaccinated. This allows us to compute the probability of contracting the virus based on the factorization defined by the PGM and if we plug in the numbers and colors we get about 9%.
Based on the previous hypothesis you can update very simply the parameters of the conditional probabilities in TKRISK using the interface. Remember that the probability of being exposed was 30% so 30 true 70 false. The probability of catching the virus if we're not exposed is 0 while if we're exposed and vaccinated we said that the probability of being infected was 10% so 90% not infected while 50-50 in the case of no vaccination. We then sample and we get a probability of getting covid of about 10%.
In order to see how close we get to the actual solution we can modify the number of samples to be a bit more accurate. If we re-sample with 10,000 it takes a bit more time. Now we get a value that is closer to 8.75%. We can also use the “low discrepancy sequences” module which allows us to more efficiently sample the space or with 1000 sample and get a value that is close to 8.7% and we see that in this case increasing the number of samples should not really change much the result that we get is around 9%.
Now if we compare this with the analytical calculation we find results that are pretty similar
We review with this example the logic and applicability of Bayesian networks. We are able to closely match the analytical solution thanks to efficient sampling methods including low discrepancy sequences. This is the first of a three parts demo.
Let us see how one can use TKRISK to analyze COVID-19 vaccine scenarios.
We will demonstrate that with the TKRISK interface. We can start by building a simple network that we will call “COVID simple “
We start with a central categorical node called “Got covid” that can take two outcome: true or false with a 50% chance each of happening. Let's now add another categorical node called “exposed” or being exposed or not to the virus and again its value can be true or false. And we add the third node called “vaccinated” that can be true or false. Now getting covid is dependent on 2 conditions: being vaccinated or not and being exposed or not so we draw connections between “vaccinated” and “got covid” and “exposed” and “got covid”.
Let us now see how the logic of the PGM is implemented in TKRISK and how we can parameterize it with very simple hypothesis. Let us assume we have a 30% chance of getting exposed to the virus, a 50% chance of getting vaccinated, and if exposed, you have a 50% chance of getting infected if not vaccinated, while 10% of getting infected if vaccinated. This allows us to compute the probability of contracting the virus based on the factorization defined by the PGM and if we plug in the numbers and colors we get about 9%.
Based on the previous hypothesis you can update very simply the parameters of the conditional probabilities in TKRISK using the interface. Remember that the probability of being exposed was 30% so 30 true 70 false. The probability of catching the virus if we're not exposed is 0 while if we're exposed and vaccinated we said that the probability of being infected was 10% so 90% not infected while 50-50 in the case of no vaccination. We then sample and we get a probability of getting covid of about 10%.
In order to see how close we get to the actual solution we can modify the number of samples to be a bit more accurate. If we re-sample with 10,000 it takes a bit more time. Now we get a value that is closer to 8.75%. We can also use the “low discrepancy sequences” module which allows us to more efficiently sample the space or with 1000 sample and get a value that is close to 8.7% and we see that in this case increasing the number of samples should not really change much the result that we get is around 9%.
Now if we compare this with the analytical calculation we find results that are pretty similar
Up Next: