COVID-19 Vaccine Response - II
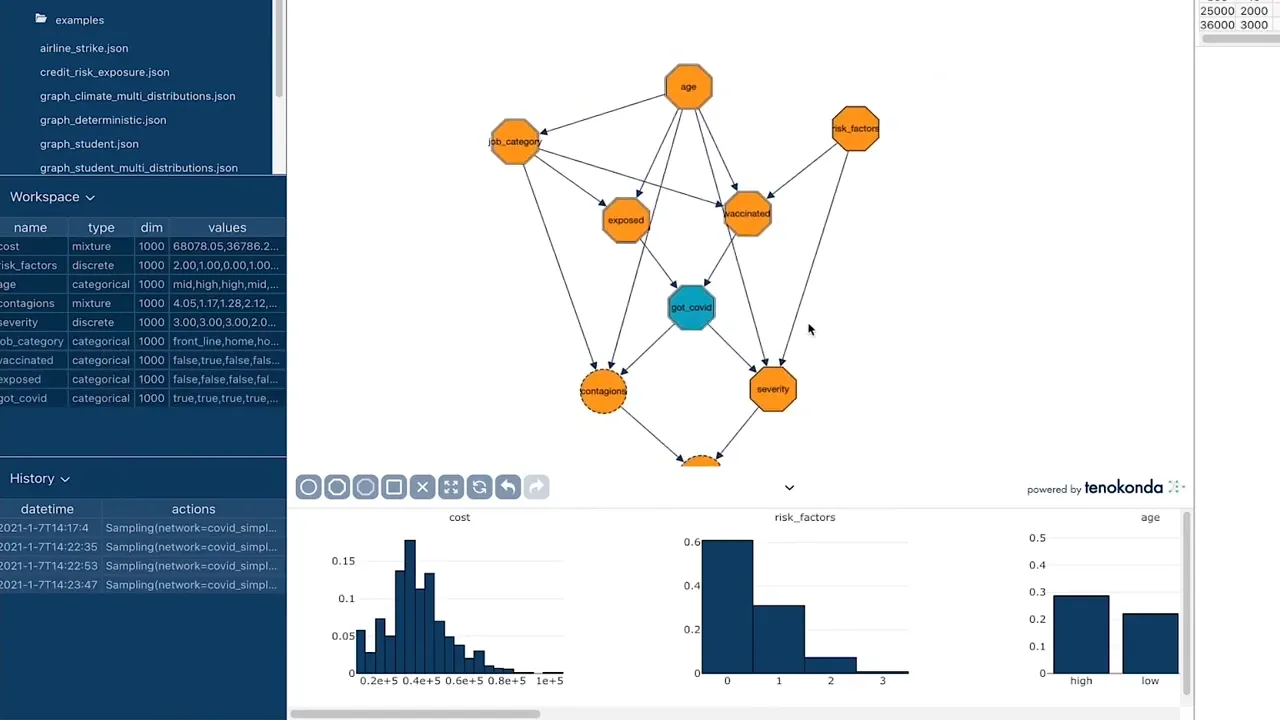
In the second part, we demonstrate how to update a model based on acquired knowledge. We refine our initial model (built in Part 1) based on prior knowledge. We show how easily information collected in news publications about cases numbers and vaccine efficacy can be integrated in the model. We show how this added information helps improve our original estimations on the probability of being infected. We also review how we can set specific nodes values and obtain the probability of being infected if vaccinated or not. This option allows to test scenarios.
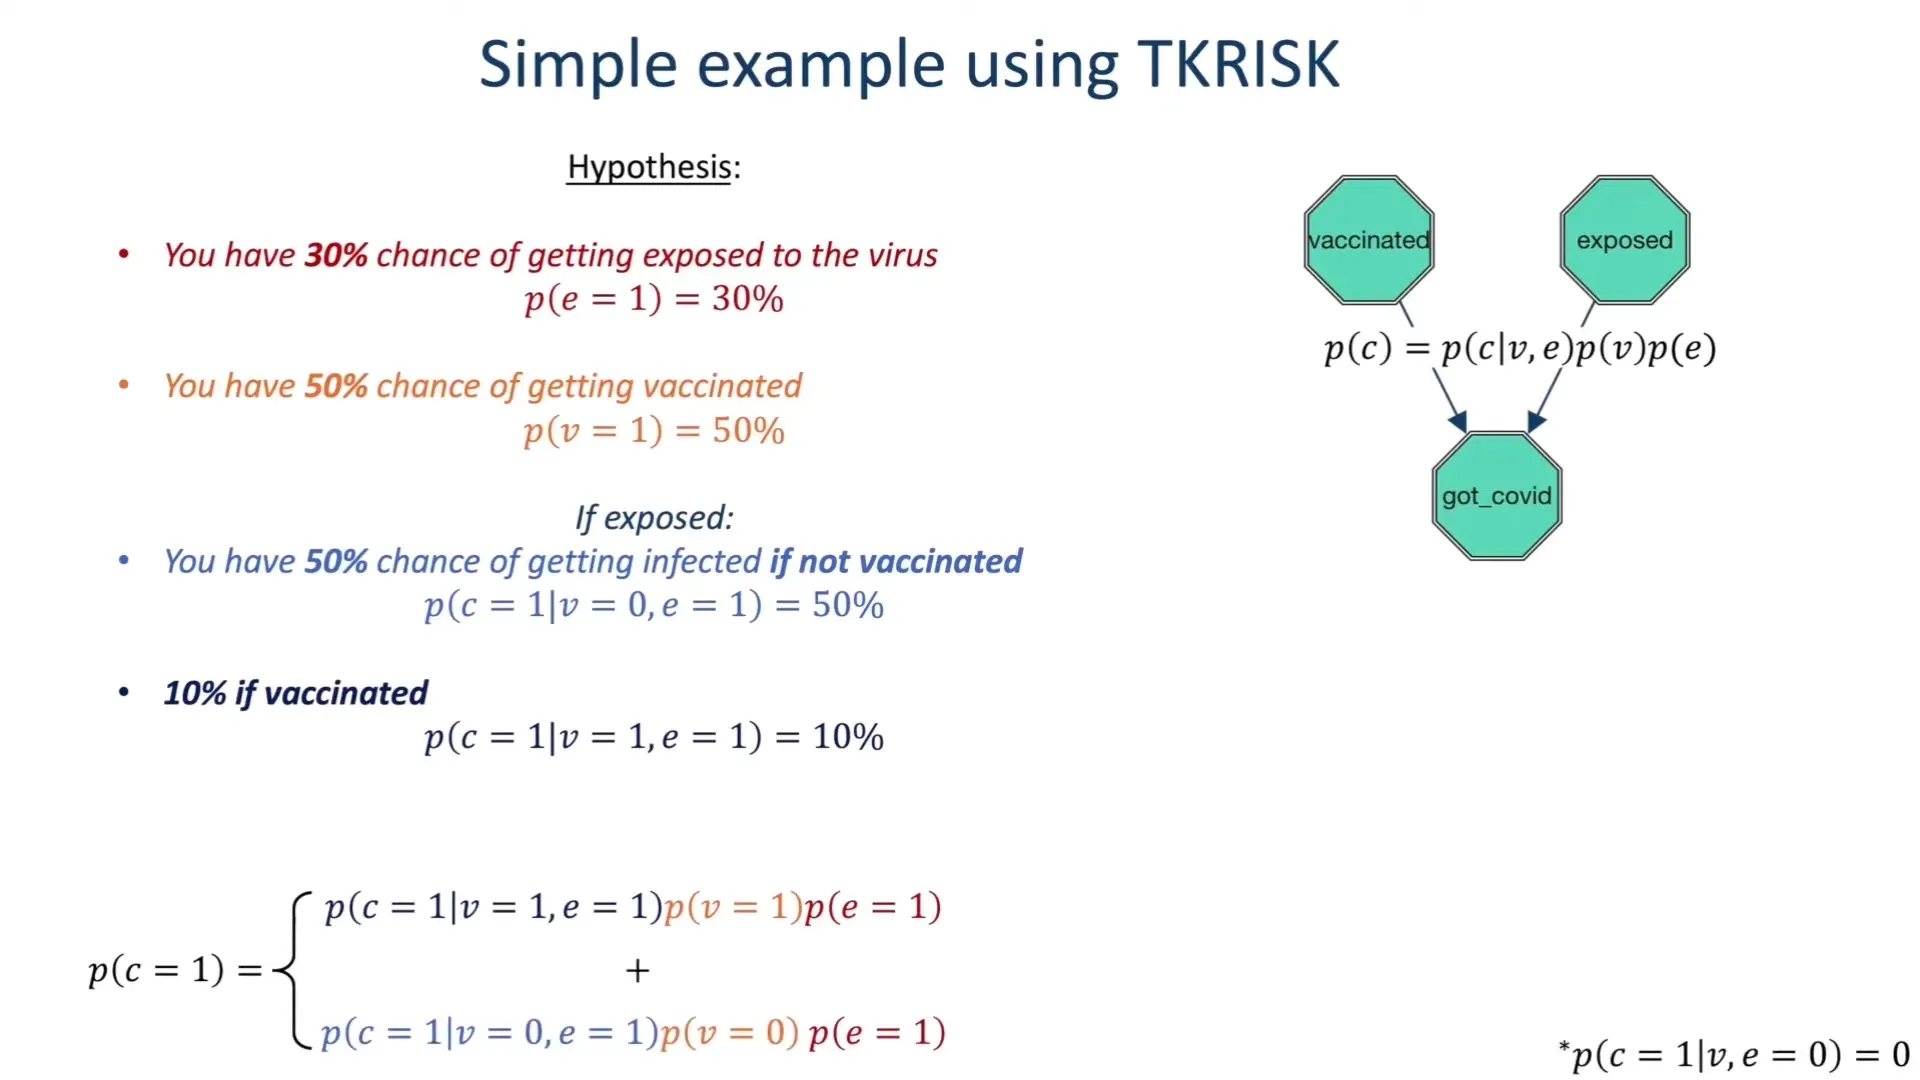
Let us now see with those simple hypothesis what would happen if we fixed the value of the vaccinated node to say “false”. In this case if nobody gets vaccinated, what are your chances of catching covid? In this case you have an 85% chance of not catching it and a 15% chance of catching it if you´re exposed. If we set the value of vaccination to true, we see how this changes the outcome of getting covid for which the probability drops now to about 3%
We will now see how adding information can help improve the quality of our prediction. If we look at the US figures of the number of people infected over the vaccine test period, as we see on the chart on the left this was approximately 9.7 million. This gives you a chance of about 3% of catching it if you were in the US at that time.
If we look at the vaccine test group now consisting of 30,000 people taken randomly it was separated into two subgroups: a placebo and a vaccine group. The total number of people infected reported by Pfizer and Moderna during this test phase was 170 and 196, of which about 10 only had received the vaccine. This gives you a chance of catching the virus if being vaccinated of 0.6% and an efficacy based on the formula presented of 95% which is consistent with what was reported.
These numbers allow us to refine the conditional probabilities of catching the virus if vaccinated or not at 1.16% if vaccinated versus 0.06% if not vaccinated. We add the hypothesis that you are five times as likely to get exposed as to get infected as seen on the picture below. This allows us to update the marginal probabilities on exposure numbers. We get a probability of catching the virus if not vaccinated of 20%, a probability of exposure of 5.8% and a probability of catching the virus if vaccinated dropping to 1%.
Once again we can update the graph parameters based on this added information. The probability of exposure based on the marginal calculated is now 6% versus 94% of not being exposed. And then the conditional probability of catching the virus if vaccinated drops to 1% or 99% of no infection while if you´re not vaccinated this ratio is 20 %, 80%. You can re sample increasing the number of samples to 10,000 and we get a probability of catching the virus overall. We can now test for the different groups to see if we can recover the same results as presented. If we set the vaccinated node to false so no vaccination and we sample, we get the probability of catching covid of about 1.25% versus 1.16 if you remember while if we set the node to true and re sample… you see that this priority drops to 500 Micron or 0.05%
If we go back to the numbers that we had before you see that we get pretty close to what is computed theoretically
Up Next: